


IT Monitoring
Back to glossaryWhat Is IT Monitoring?
IT monitoring refers to the continuous observation, measurement, and analysis of an organization’s IT systems—hardware, software, networks, applications, and services. Its core objective is to ensure that IT infrastructure operates efficiently, remains secure, and delivers optimal uptime and performance. Whether on-premises, in the cloud, or in hybrid environments, IT monitoring provides IT teams with the visibility and insights needed to detect anomalies, respond to incidents, and support business continuity.
By collecting real-time data and metrics across systems, IT monitoring helps organizations proactively:
- Identify and address performance degradation
- Prevent downtime and outages
- Optimize resource usage
- Meet service-level agreements (SLAs)
- Align IT operations with business goals
IT monitoring is not limited to technical observability; it plays a strategic role in enabling digital performance and business resilience.
Summary Table: IT Monitoring at a Glance
| Aspect | Description |
| Objective | Ensure availability, performance, and health of IT systems |
| Scope | Infrastructure (servers, networks, storage), applications, cloud, security |
| Core Activities | Data collection, alerting, dashboards, reporting, automation |
| Benefits | Reduced MTTR, improved uptime, optimized IT efficiency |
| Stakeholders Involved | ITOps, Tech Leads, CIOs, Application Owners, DevOps |
| Tools | Monitoring software platforms (e.g., Centreon, Zabbix, Prometheus) |
Why It Matters in a Digital World
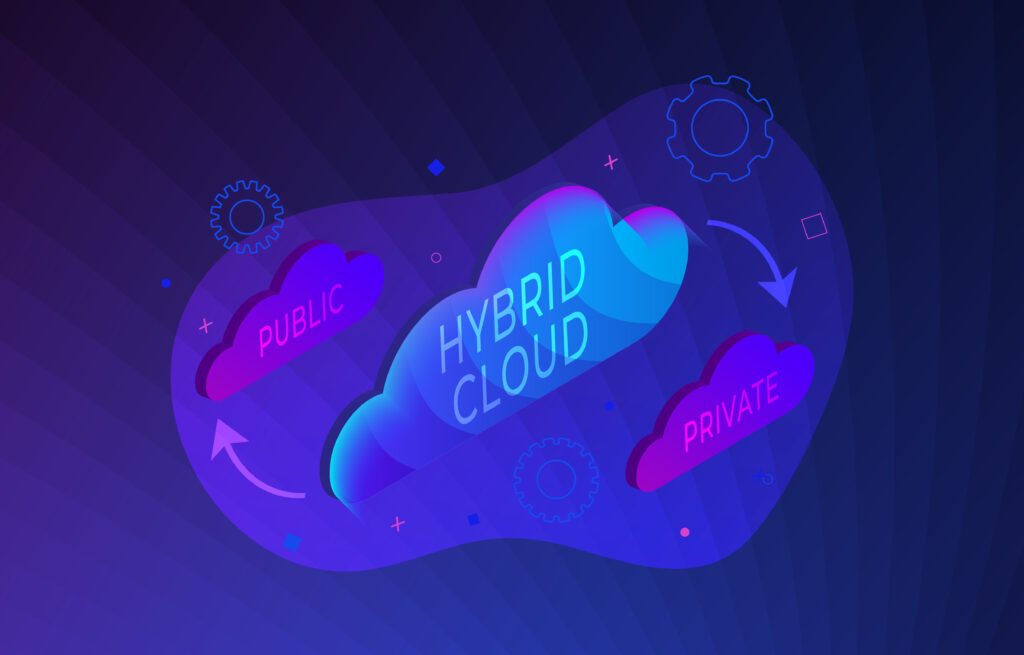
As businesses become increasingly digital, the complexity of IT environments rises sharply. Hybrid clouds, virtualization, containers, IoT, and remote work infrastructures introduce new challenges. IT monitoring ensures that organizations:
- Maintain visibility across all systems and locations
- Minimize service interruptions that could affect revenue and reputation
- Adapt to evolving technologies with agility and precision
A reliable IT monitoring strategy is essential to prevent blind spots, reduce unnecessary costs, and maintain an excellent user experience.
Why IT Monitoring Matters Today
In an era where organizations rely on digital services to operate, compete, and grow, IT monitoring is no longer a technical afterthought—it is a business-critical function. Enterprises, public agencies, and managed service providers must guarantee system reliability, application performance, and service continuity at all times.
Modern IT environments are:
- Distributed across data centers, clouds, and edge devices
- Increasingly reliant on third-party services and APIs
- Subject to growing performance, compliance, and security demands
IT monitoring plays a pivotal role in delivering on these challenges. It offers a real-time, unified view of infrastructure health and business-critical systems, enabling teams to react faster and make smarter decisions.
Aligning IT with Business Needs
Today’s organizations require more than raw technical data. They need to understand how infrastructure performance impacts business processes, customer experience, and revenue. This is where Business-Aware IT Monitoring comes in.
Rather than only tracking CPU load or disk space, modern IT monitoring focuses on:
- Correlating technical metrics with business service availability
- Prioritizing incidents based on their impact on business processes
- Enabling collaboration between ITOps, DevOps, and business stakeholders
This alignment transforms IT monitoring into a strategic asset that supports digital transformation, agility, and customer satisfaction.
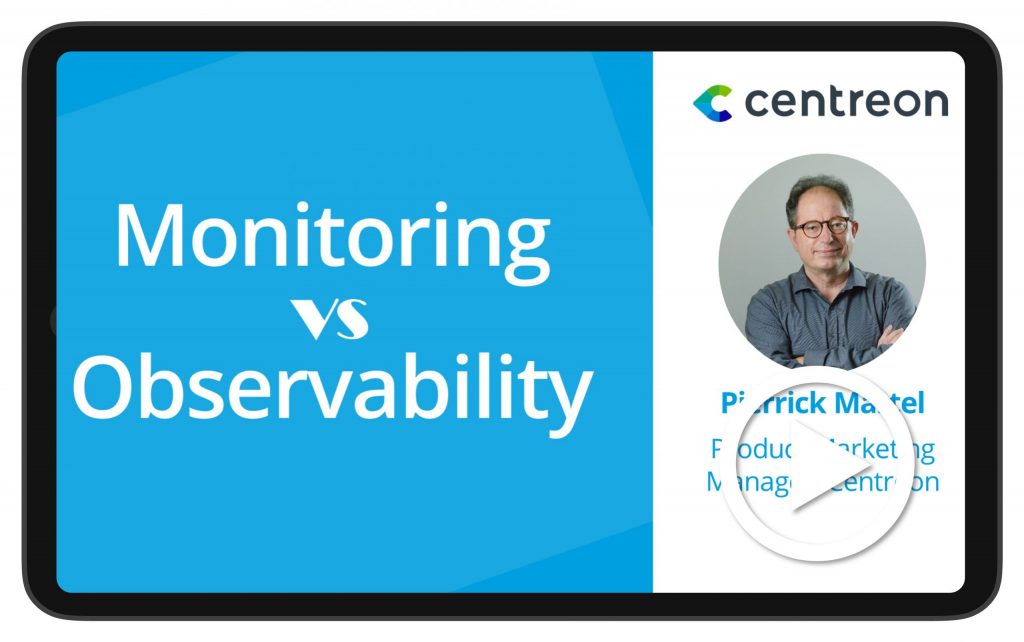
IT Monitoring vs. Observability: What’s the Difference?
While often used interchangeably, IT monitoring and observability are not the same. They are complementary approaches that together deliver deeper insights into IT environments.
| Feature | IT Monitoring | Observability |
| Focus | Known problems and metrics | Unknown issues and system behavior |
| Data Sources | Metrics, status checks, logs | Metrics, logs, traces (full telemetry) |
| Approach | Reactive to threshold breaches | Proactive, analytical, exploratory |
| Typical Tools | Centreon, Zabbix, Nagios | OpenTelemetry, Grafana, New Relic, Jaeger |
| Use Case | Ensure uptime and SLAs | Investigate root cause and complex dependencies |
Key takeaway: IT monitoring helps detect and alert you to performance issues, while observability provides the context and depth needed to understand and resolve them.
Learn more about how Centreon supports observability and monitoring integration.
Benefits of Strategic IT Monitoring
When IT monitoring is embedded as a strategic layer of your IT operations, it helps:
- Eliminate blind spots across hybrid and multi-cloud environments
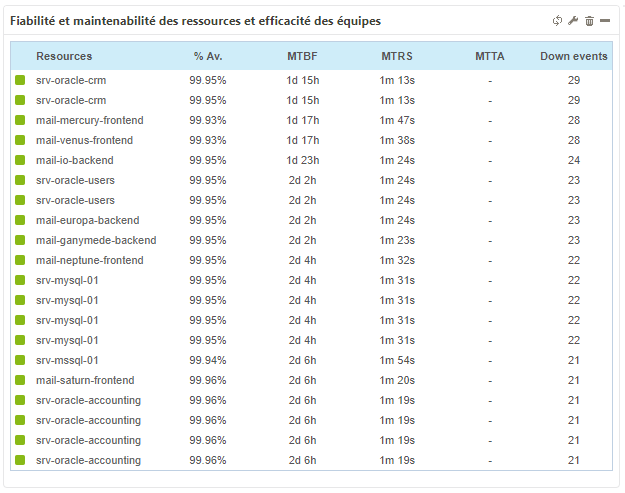
- Reduce incident response times (MTTI/MTTR)
- Enhance SLA compliance and reporting
- Optimize resource planning and cost control
- Build trust between IT and business units through transparency
It’s not just about collecting data—it’s about turning data into operational and business value.
The Core Functions of IT Monitoring
At its core, IT monitoring is about making the invisible visible. It transforms the constant stream of raw data from systems, applications, and networks into meaningful, actionable insights. These insights enable IT teams to maintain service quality, detect and resolve issues quickly, and align operations with business priorities.
Modern IT monitoring solutions perform four essential functions:
- Collect data from IT systems
- Analyze performance metrics and detect anomalies
- Alert IT teams to potential or actual incidents
- Visualize information through dashboards and reports
Let’s explore these in more detail.
Monitoring System Components
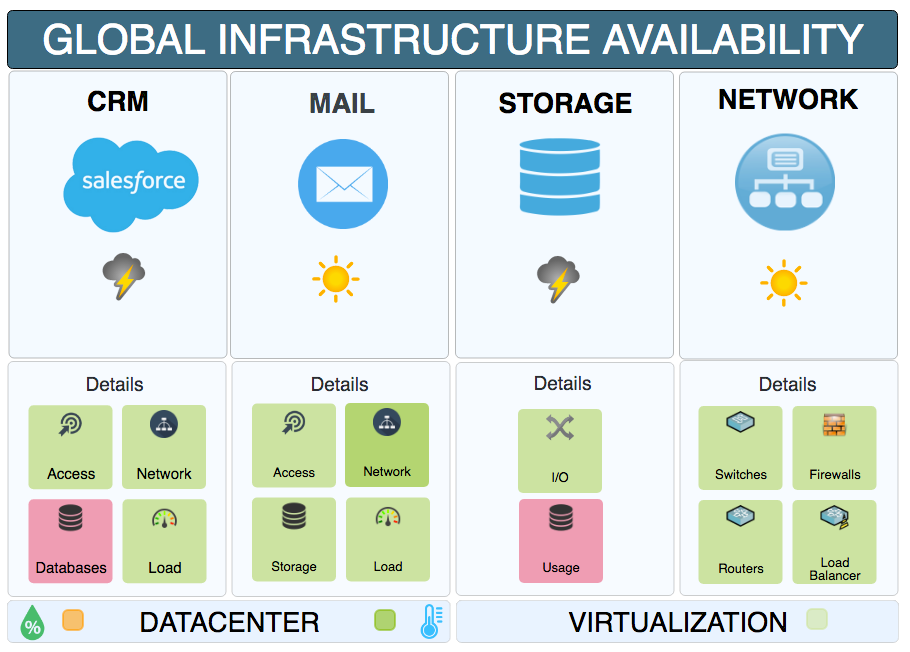
A robust monitoring platform continuously tracks the status and performance of all infrastructure components across the IT environment, including:
Servers & Virtual Machines
- CPU usage
- Memory consumption
- Disk I/O and storage capacity
- System load and uptime
- Physical and virtual server performance
Network Infrastructure
- Router, switch, and firewall availability
- Bandwidth utilization
- Packet loss and latency
- Interface errors and link integrity
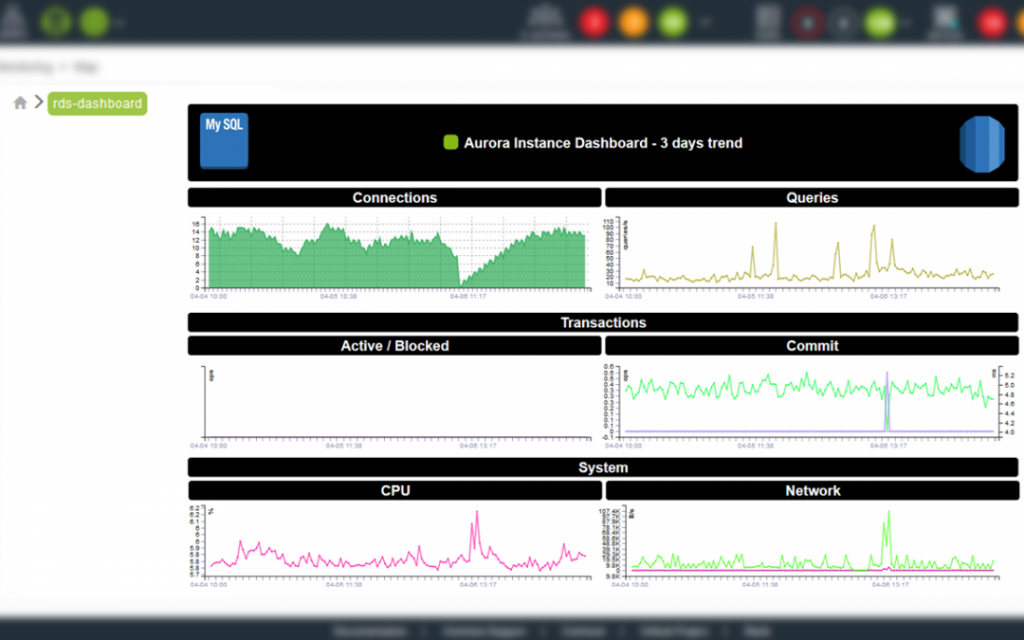
Applications
- Transaction response times
- Error rates and failure patterns
- Database query performance
- Application uptime (web, mobile, SaaS)
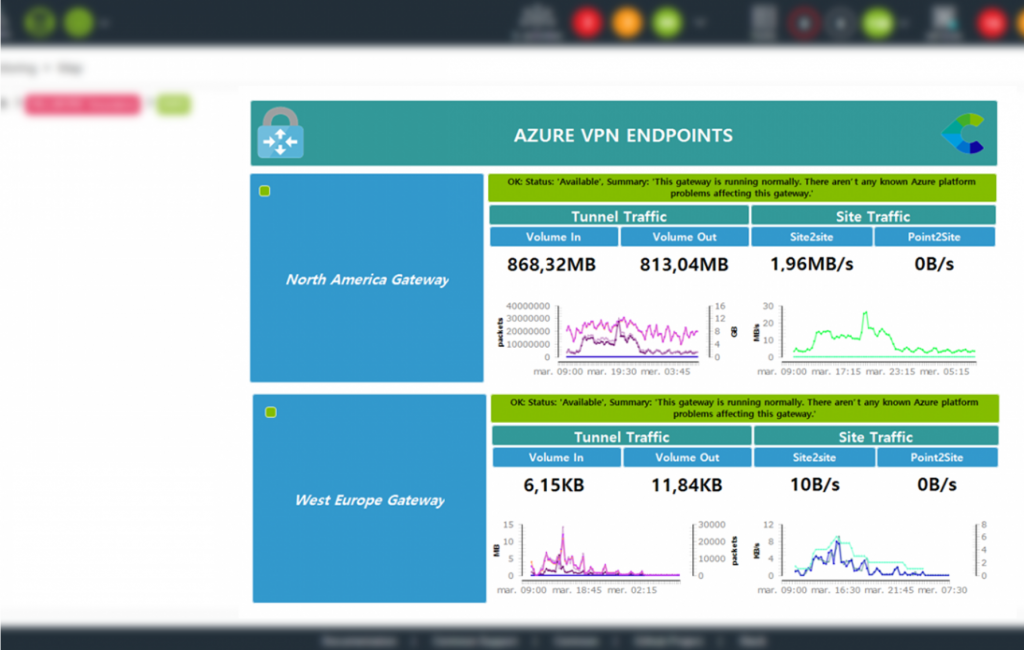
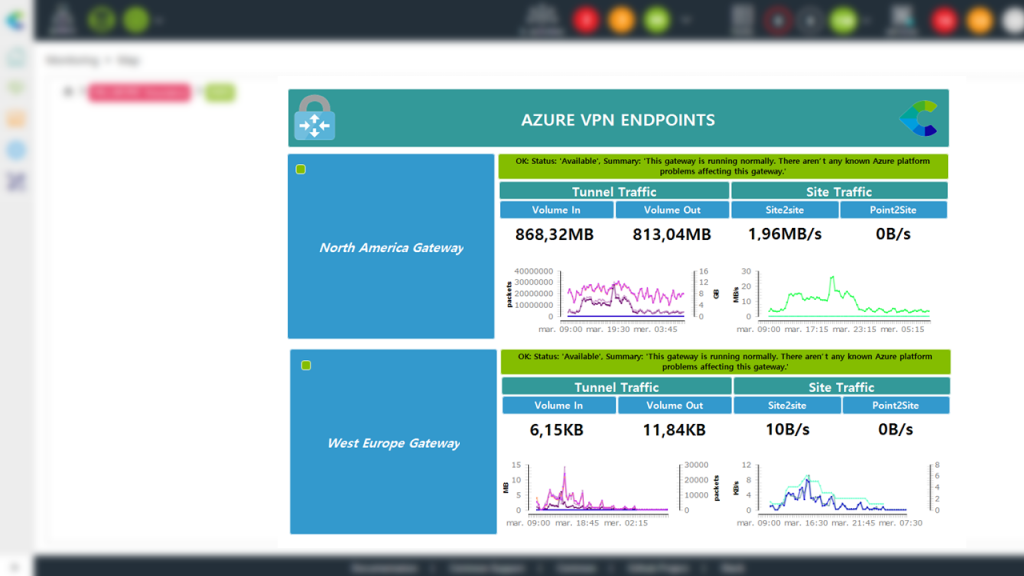
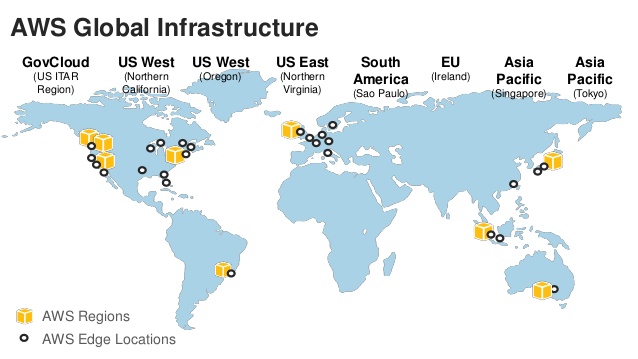
Cloud & Hybrid Environments
- Compute and storage resources (AWS, Azure, GCP)
- API and service integrations
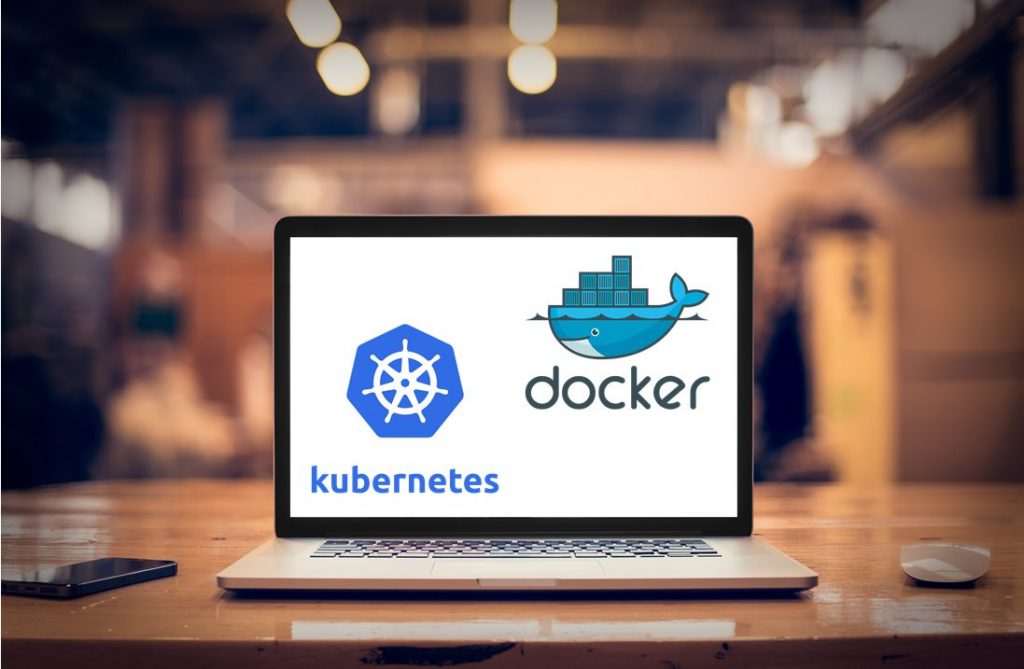
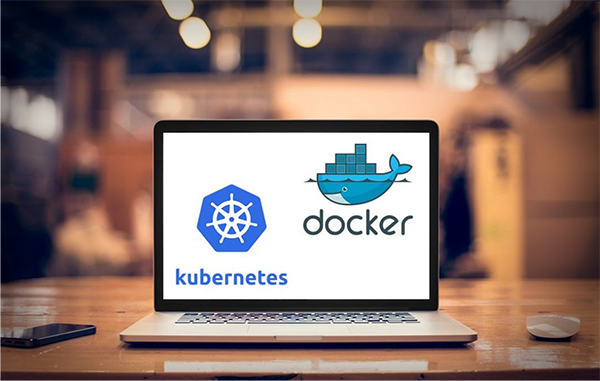
- Containerized services (Docker, Kubernetes)
- Public/private/hybrid cloud monitoring
Explore how Centreon supports full-stack infrastructure monitoring.
Performance & Availability: The Twin Pillars of Monitoring
IT monitoring focuses on two critical dimensions:
- Performance: How well systems are running (speed, responsiveness, stability)
- Availability: Whether systems are up and accessible when needed
Together, these metrics ensure a seamless experience for users and uninterrupted delivery of IT services.
Examples of performance metrics monitored include:
- CPU, memory, and disk usage trends
- Network throughput and latency
- Application response times and availability
- Database connection load
By continuously measuring these indicators, IT teams can proactively address degradation and avoid SLA breaches.
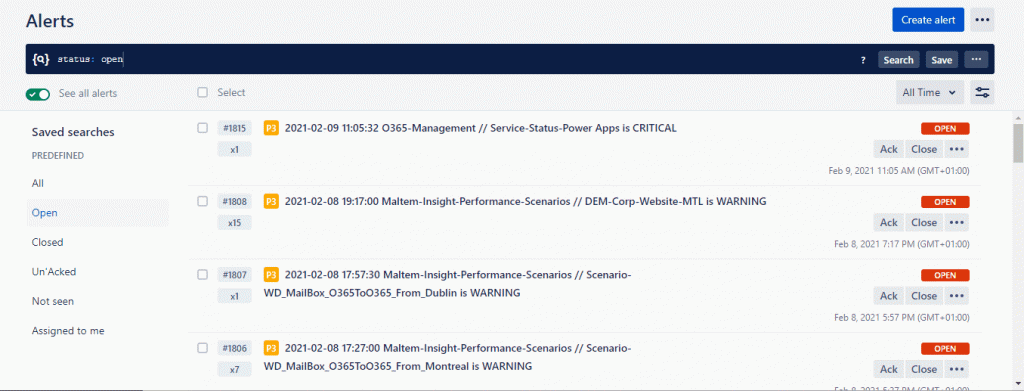
Real-Time Alerting: Catch Problems Before They Escalate
Timely alerts are essential for minimizing downtime and supporting rapid incident resolution. Monitoring tools trigger real-time notifications when:
- A threshold is breached (e.g., CPU > 90%)
- An application becomes unresponsive
- A security event occurs
- A critical resource is unavailable
Best Practices for Effective Alerts:
- Set smart thresholds based on historical trends
- Group related alerts to reduce noise
- Use escalation policies to prioritize response
- Automate first-level responses when possible
Centreon’s alerting system helps reduce alert fatigue by refining how notifications are triggered, grouped, and presented.
Learn more about Centreon’s Features and capabilities.
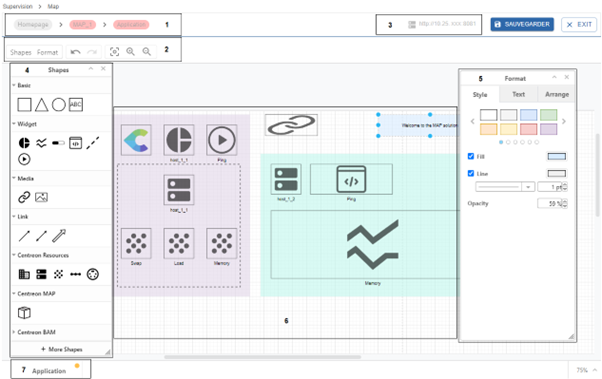
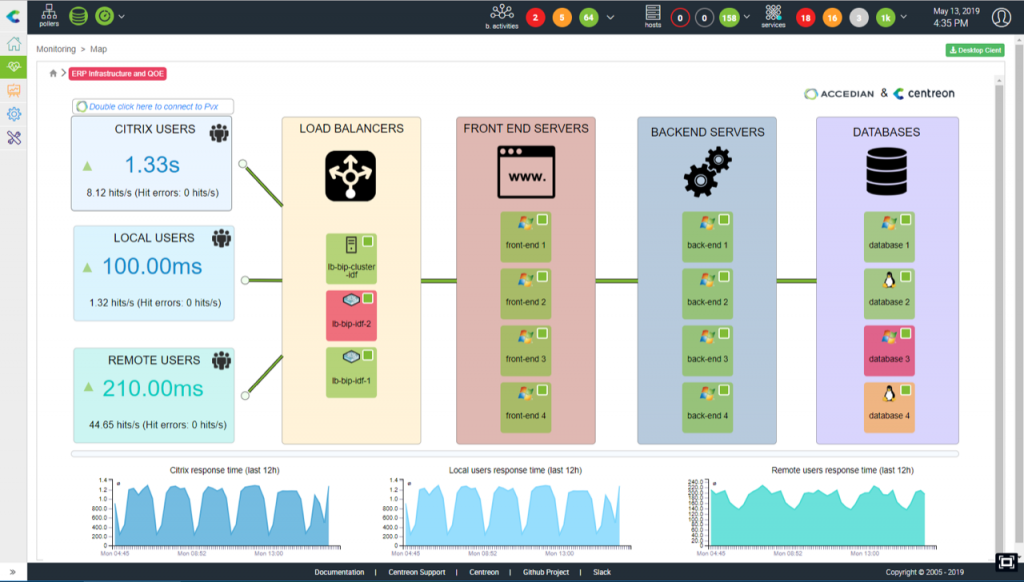
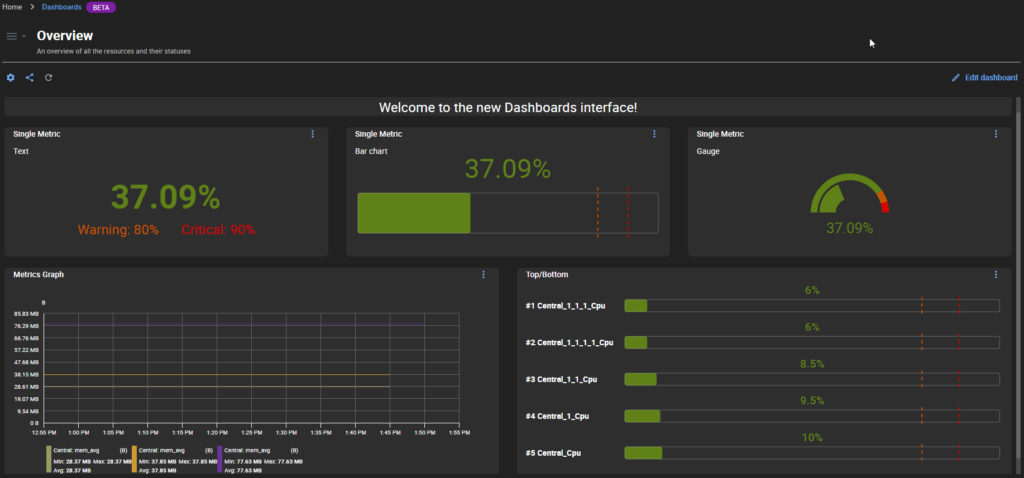
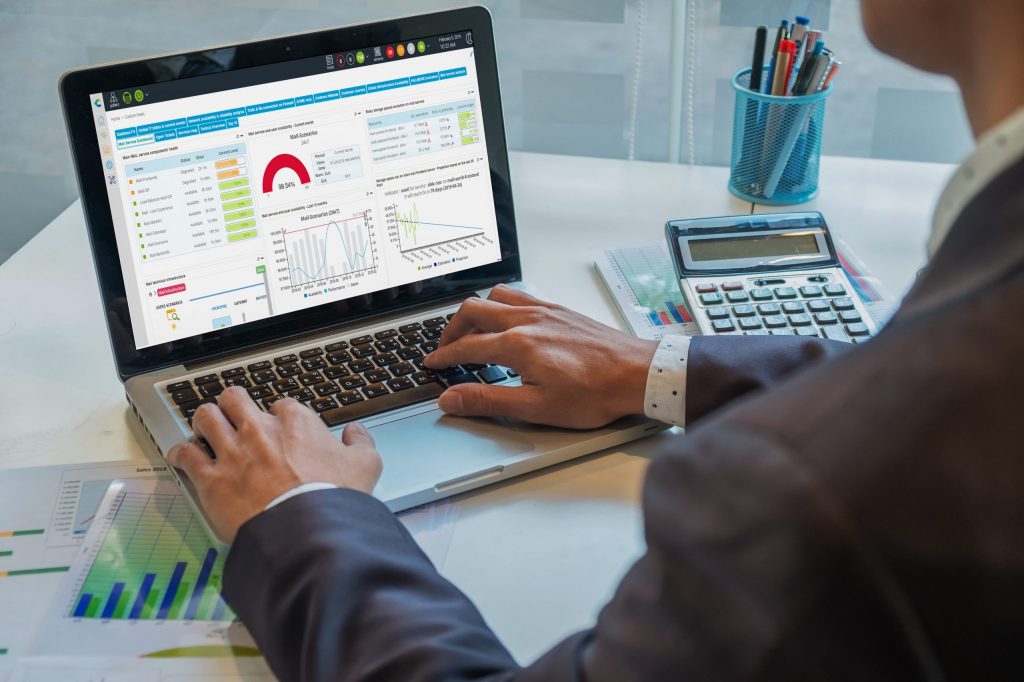
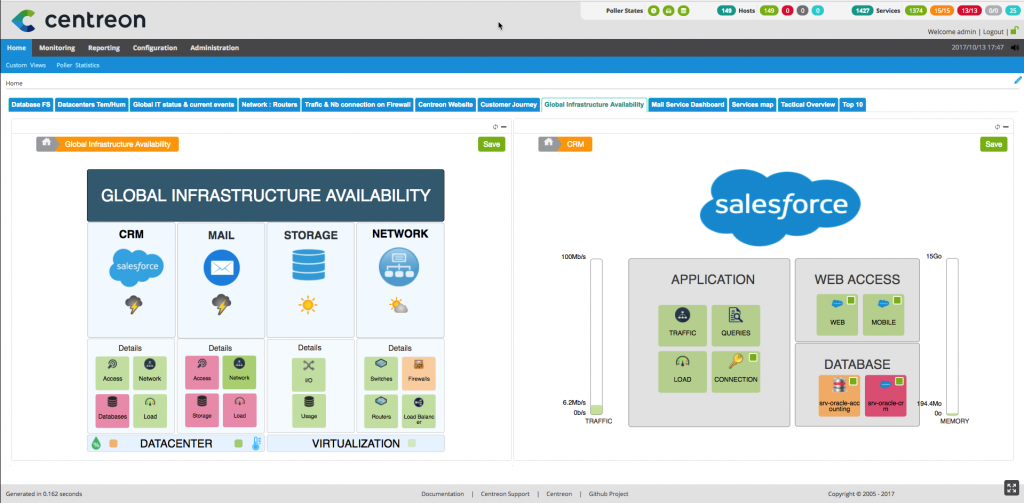
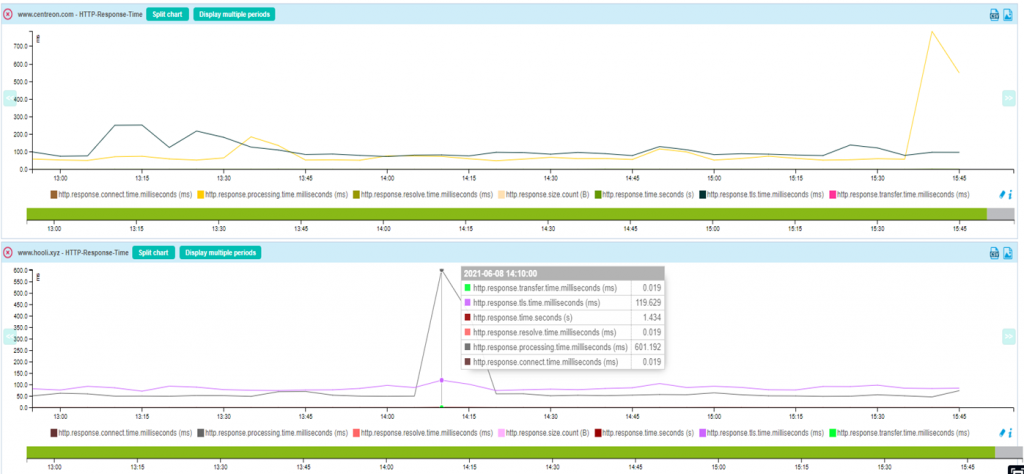
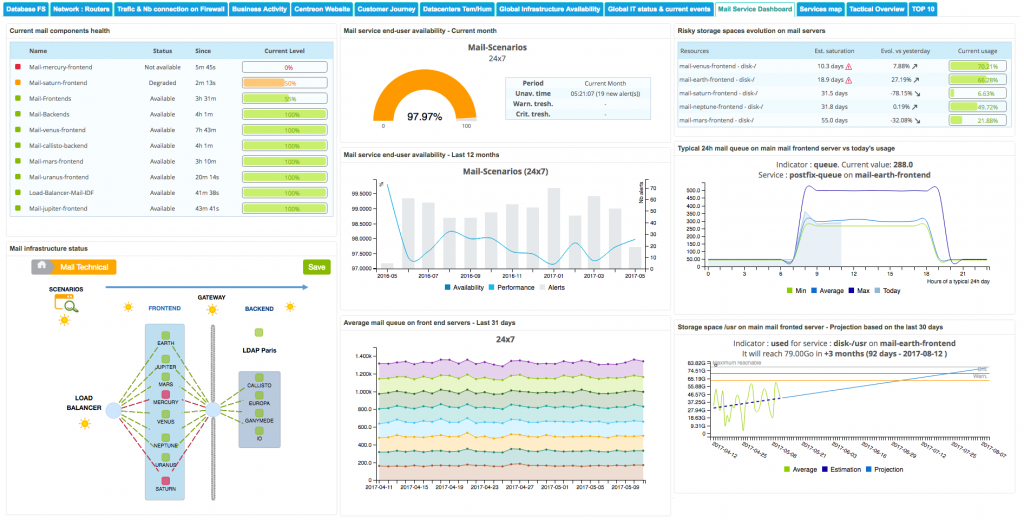
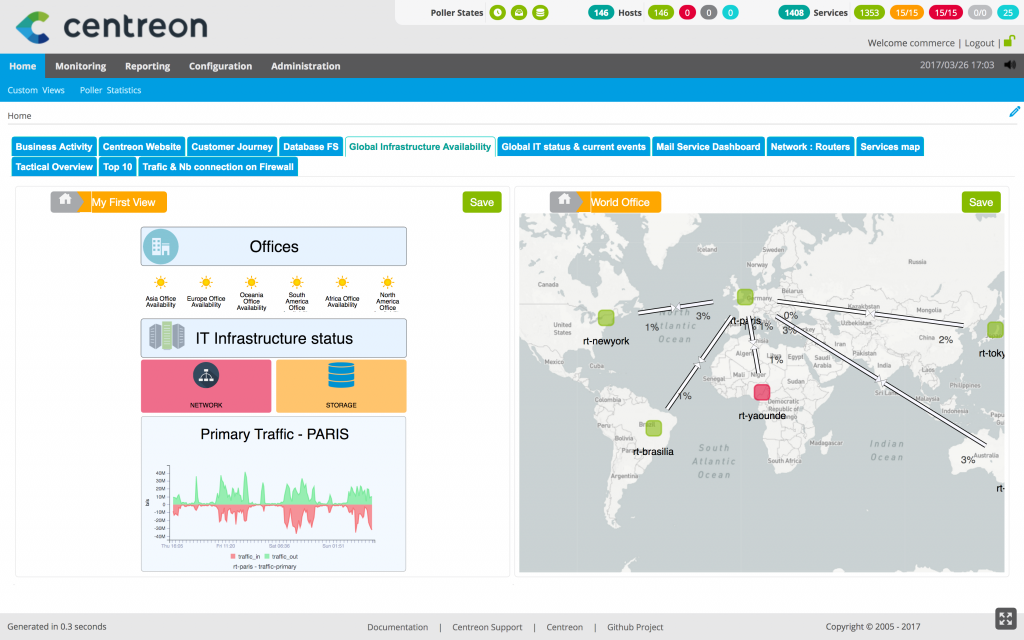
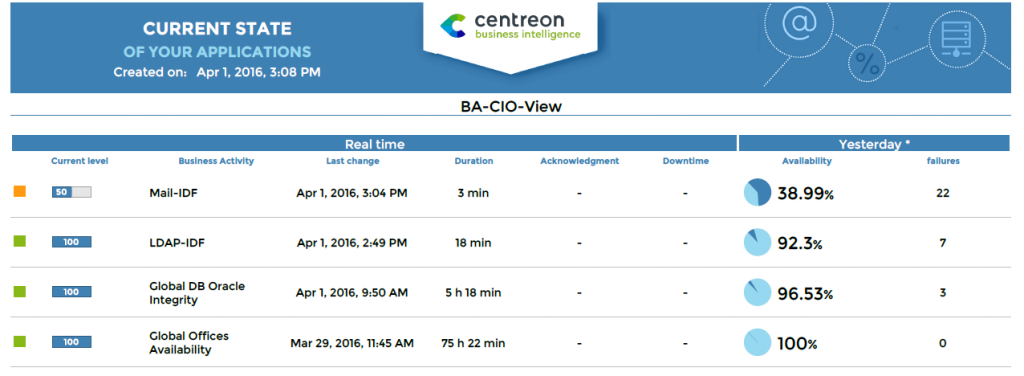
Unified Dashboards & Reporting
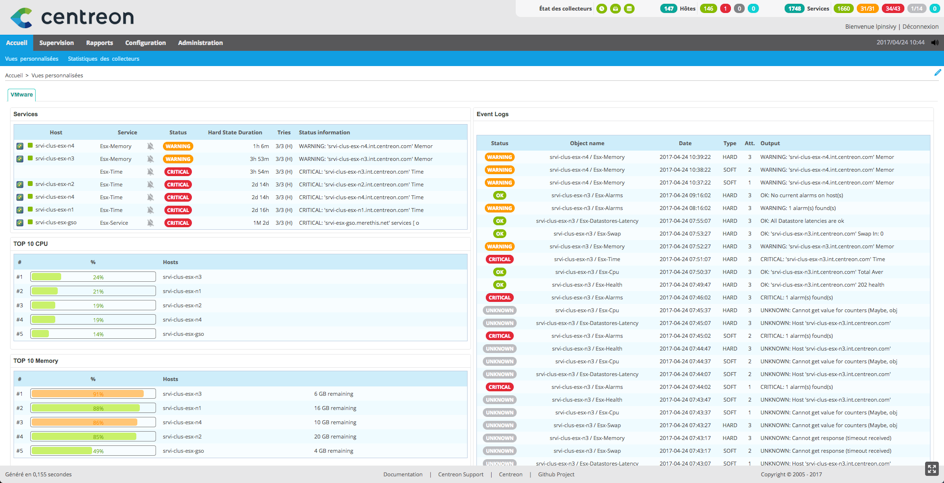
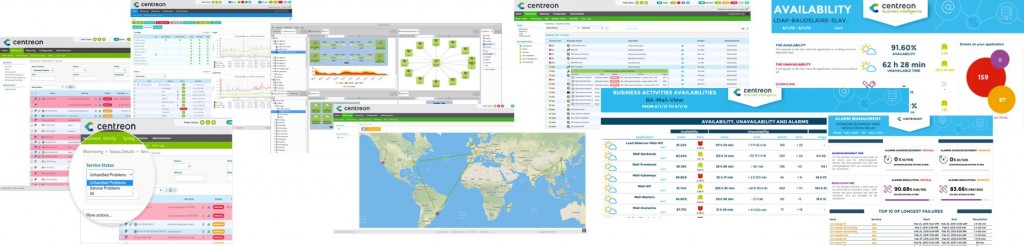
Dashboards are at the heart of decision-making in IT monitoring. A good dashboard turns metrics into visual insights—offering an at-a-glance view of IT health across services and infrastructure.
Key Features of Monitoring Dashboards:
- Real-time status of critical components
- Performance and SLA metrics
- Custom views per team (ITOps, DevOps, business)
- Drill-down capabilities for root cause analysis
Centreon offers customizable, shareable dashboards with rich visualization and user access control.
Summary: IT Monitoring Capabilities Overview
| Function | Description |
| Data Collection | Agents, probes, connectors gather system, network, and app data |
| Performance Analysis | Metrics reviewed for thresholds, trends, and anomalies |
| Alerting | Real-time issue detection and escalation |
| Dashboards | Visual tools for system health, KPIs, SLA, capacity planning |
| Reporting | Scheduled or ad hoc reports for compliance and optimization |
Together, these functions form the foundation of a reliable, unified IT monitoring system.
The 3 Main Types of IT Monitoring
Modern IT monitoring is multi-layered. To maintain optimal uptime, performance, and user experience, organizations must monitor not only individual components—but also how those components interact as part of a larger system.
Three primary types of IT monitoring form the foundation of a comprehensive monitoring strategy:
- System Monitoring
- Network Monitoring
- Application Performance Monitoring (APM)
These disciplines work together to offer a unified view of digital infrastructure health and availability.
System Monitoring
System monitoring (also known as host or infrastructure monitoring) focuses on tracking the physical and virtual machines that run your IT workloads.
It provides insights into:
- CPU and memory utilization
- Disk capacity and I/O throughput
- Operating system health (e.g., Linux, Windows, Unix)
- System load, uptime, and process activity
- Virtualization layers (e.g., VMware, Hyper-V)
Why It Matters
System monitoring helps IT teams detect early warning signs of:
- Resource saturation (e.g., memory leaks, CPU spikes)
- Imminent hardware failures
- OS-level misconfigurations or errors
Without this foundational layer, higher-level services (applications, cloud services) would be blind to the root cause of performance degradation.
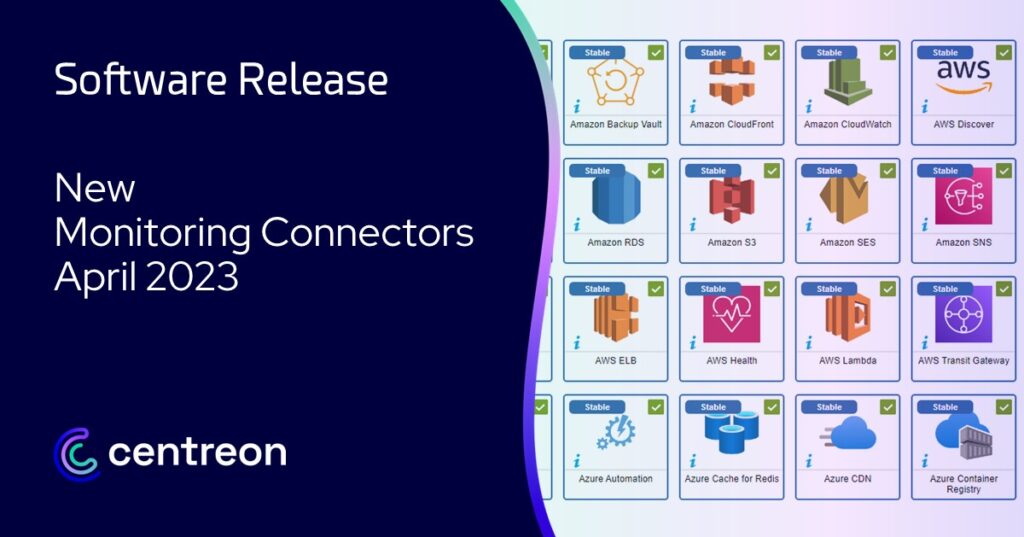
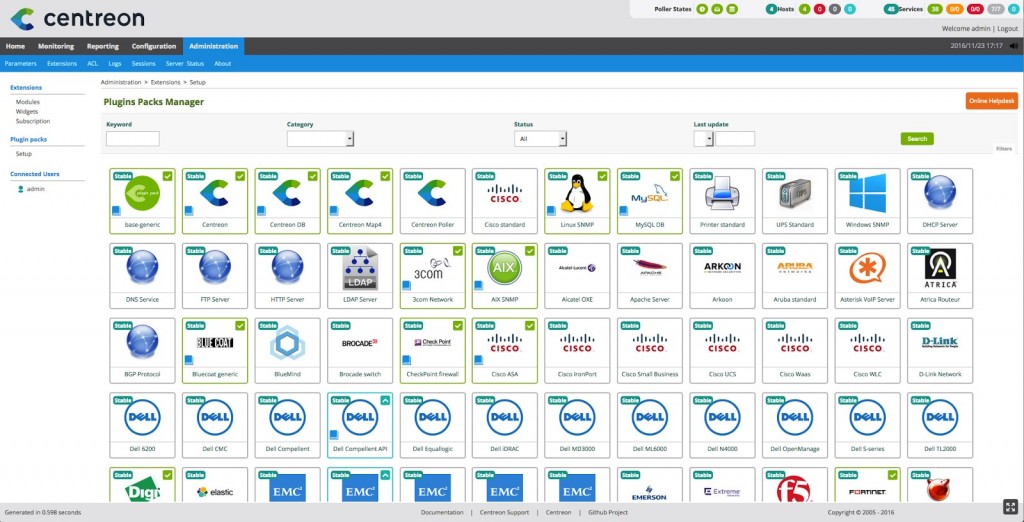
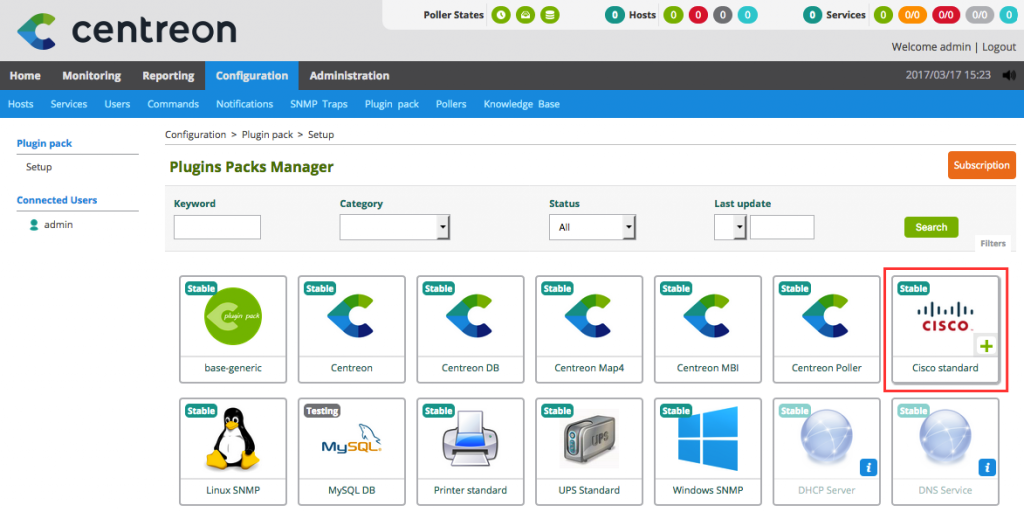
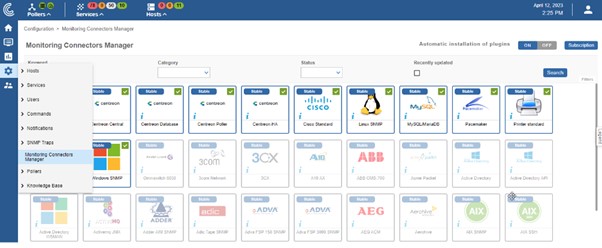
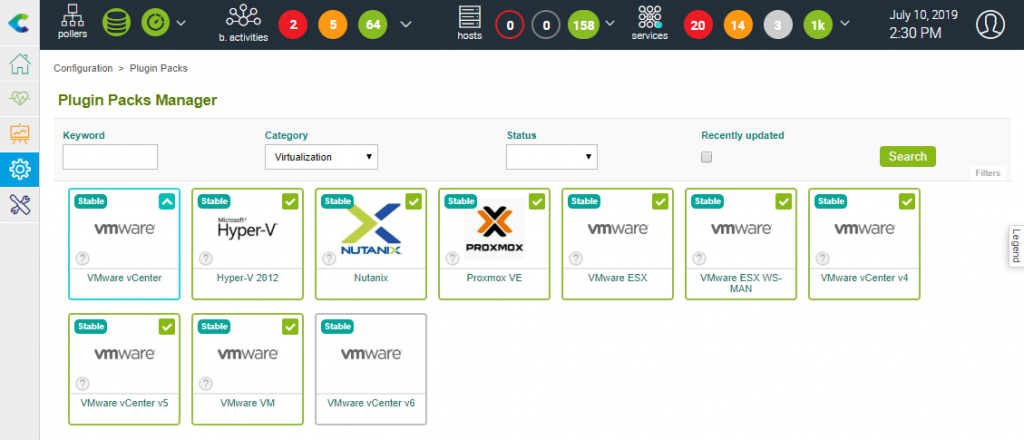
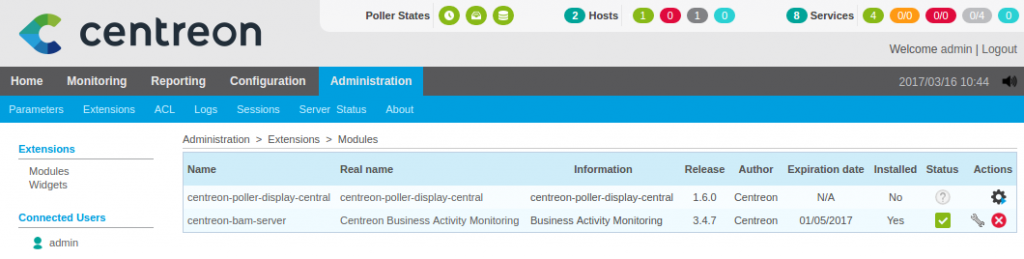
Centreon supports system monitoring out-of-the-box through hundreds of ready-to-use connectors.
Network Monitoring
Network monitoring tools provide real-time visibility into the health, availability, and performance of your network infrastructure. This includes:
- Routers, switches, and firewalls
- Bandwidth usage and congestion levels
- Packet loss, jitter, and latency
- Wireless access points, VPNs, and SD-WAN nodes
- Interface health and configuration status
Benefits of Network Monitoring:
- Detect bottlenecks before they impact services
- Ensure secure and reliable data transmission
- Maintain stable connectivity for all users and applications
- Enforce QoS (Quality of Service) for critical applications
Network monitoring ensures the infrastructure “pipes” remain operational and optimized. When traffic slows or fails, it’s the first line of defense.
Learn how Centreon delivers reliable network monitoring across distributed environments.
Network Performance Monitoring Tools: A Core Layer for Efficiency
To maintain overall operational efficiency, organizations must closely monitor network behavior—not just for uptime, but also for quality of service (QoS).
This is where network performance monitoring tools come in.
These tools track metrics such as:
- Latency and packet loss
- Bandwidth usage and saturation points
- Jitter and throughput
- Interface errors and congestion hotspots
By analyzing this data in real time, IT teams can:
- Detect and troubleshoot connectivity issues
- Optimize load balancing across WAN and SD-WAN
- Prioritize critical business applications
- Prevent cascading failures across distributed services
Integrated platforms like Centreon provide built-in network performance monitoring dashboards that help ensure end-to-end service quality.
Application Performance Monitoring (APM)
Application Performance Monitoring (APM) focuses on how well business-critical applications are functioning from an end-user perspective.
Key metrics include:
- Application availability and uptime
- Page load and response times
- Transaction success/failure rates
- Code-level errors and stack traces
- User session behavior (real or synthetic)
Application Types Monitored:
- Web and mobile apps
- SaaS platforms (e.g., Microsoft 365, Salesforce)
- Custom applications and APIs
- Middleware and backend services
APM Tool Capabilities:
- Detect failed login attempts, transaction delays, or broken workflows
- Simulate user journeys via synthetic monitoring
- Correlate app health with infrastructure performance
By integrating APM into your IT monitoring platform, you gain a complete view from infrastructure to user experience.
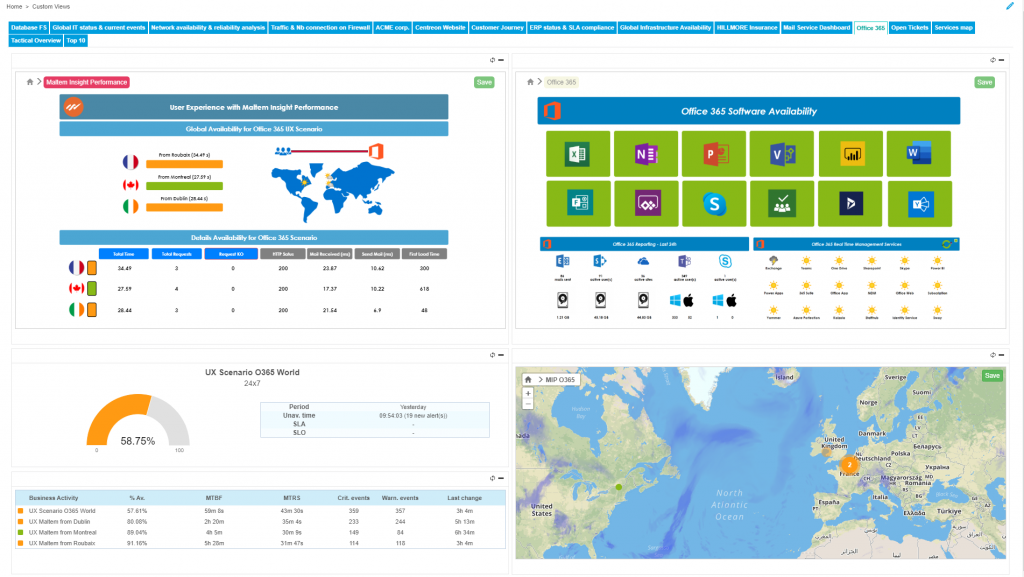
See Centreon’s approach to user experience monitoring and service health tracking.
Combined Visibility = Unified IT Monitoring
While these three types of monitoring can function independently, they deliver the most value when integrated into a single platform. This eliminates silos, improves incident diagnosis, and supports faster root cause analysis.
Table: Comparing the Three Types
| Monitoring Type | Focus Area | Typical Stakeholders | Key Tools / Metrics |
| System Monitoring | Servers, OS, Virtual Machines | ITOps, Tech Leads | CPU, RAM, disk, system load |
| Network Monitoring | Connectivity & Bandwidth | Network Admins, SecOps | Packet loss, latency, throughput |
| Application Monitoring | Software Performance | DevOps, Business Owners | Response times, error rates, availability |
Integrated into a unified IT monitoring platform, these functions deliver comprehensive insights across the entire IT stack.
Benefits of IT Monitoring for Your Organization
IT monitoring delivers tangible, measurable benefits across all levels of IT operations. Whether you are directly configuring monitoring dashboards or overseeing IT strategy, the right monitoring platform helps your organization ensure service quality, reduce downtime, optimize costs, and support digital transformation.
Let’s look at the benefits through the lens of two core stakeholders: the Monitoring Tech Lead and the IT Operations Manager.
For Tech Leads: Full Visibility, Automation & Control
The monitoring tech lead is responsible for configuring, maintaining, and extending the monitoring platform. He needs complete control, automation, and the ability to customize dashboards for different stakeholders.
Key Benefits for Tech Leads:
- 100% Visibility Across the IT Environment
Monitor all assets: legacy systems, hybrid infrastructure, containers, cloud-native services, edge devices. - Time Savings Through Automation
Reduce manual checks and configurations with auto-discovery and connector libraries. Eliminate repetitive tasks. - Easy-to-Use Tools
Fast onboarding and training for teams. UI and dashboards that adapt to technical and business users alike. - Alert Noise Reduction
Fine-tune thresholds and notification rules to avoid alert fatigue. Focus only on actionable issues. - Tool Consolidation
Replace multiple legacy systems with a unified monitoring platform, improving efficiency and reducing overhead.
Explore Centreon’s zero-config connectors for rapid setup and extensive coverage.
For ITOps Managers: SLA Compliance, Optimization & Strategic Impact
Key Benefits for ITOps Managers:
- Ensure SLA Compliance
Track uptime, MTTR, and availability in real time. Create executive-ready dashboards and reports to prove compliance. - Optimize Costs and Processes
Replace multiple tools with a single platform. Gain insight into underused resources and reduce unnecessary spending. - Future-Proof IT Operations
Support hybrid, multi-cloud, and edge strategies with scalable monitoring. Ensure monitoring grows with your IT landscape. - Support Digital Transformation
Deliver high-quality digital services to employees and customers by keeping IT infrastructure in top condition. - Manage Skills Gaps
Empower smaller teams to do more through automation, smart alerts, and centralized views.
See how Centreon’s monitoring dashboards provide visibility from ITOps to C-level.
Shared Value: Cross-Team Collaboration & Unified Visibility
Both Tech Leads and ITOps Managers benefit from:
- Centralized Monitoring across all environments (on-premises, cloud, hybrid)
- Customizable Dashboards for each team’s specific needs
- Fast Incident Resolution through real-time alerts and historical analysis
- Improved Uptime and Stability through proactive issue detection
- Strategic Decision-Making supported by accurate and contextualized metrics
Summary Table: Role-Based Benefits
| Role | Core Needs | Monitoring Benefits |
| Monitoring Tech Lead | Full control, ease of use, automation | Visibility, alert fine-tuning, tool consolidation, faster deployment |
| ITOps Manager | SLA delivery, optimization, leadership | Strategic dashboards, SLA proof, cost efficiency, digital transformation |
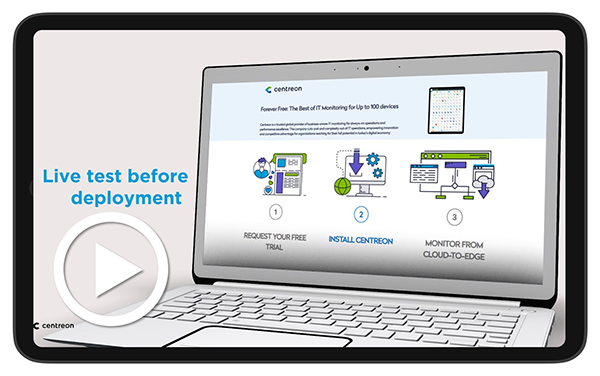
Ready to empower both operational and strategic IT roles? Try Centreon for free: SaaS trial, or the Self-Hosted free trial Centreon IT Edition 100 to monitor up to 100 devices, for free, with no time limit.
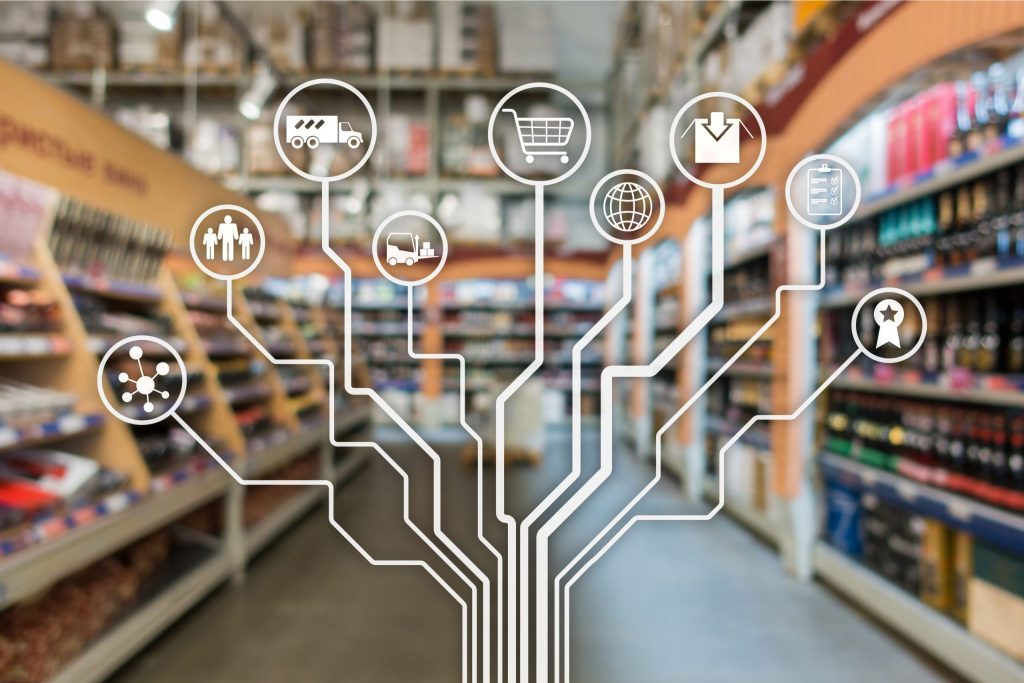
Common Use Cases by Industry
IT monitoring is not one-size-fits-all. Each organization—whether enterprise, public sector, or service provider—faces different technical challenges and strategic goals. Monitoring platforms must be flexible enough to address those variations, while providing a unified view of infrastructure health and performance.
Below are four common industry use cases that illustrate the importance and versatility of IT monitoring.
Enterprise Monitoring: Ensuring Digital Continuity at Scale
Large enterprises often manage thousands of devices, services, and distributed systems. Ensuring that these components operate flawlessly is essential to deliver digital services to customers, employees, and partners.
Typical Challenges:
- Complex hybrid environments with on-prem, cloud, and edge systems
- Fragmented toolsets across business units
- Need to maintain 24/7 service availability and
- Reduce MTTR
Key IT Monitoring Contributions:
- Centralized dashboards for business-wide visibility
- SLA tracking and compliance reporting
- Unified alerting and incident response across all infrastructure layers
Learn how European Retailer Monoprix uses Centreon to monitor 725 stores and ensure customer satisfaction across retail operations.
Public Sector Monitoring: Service Continuity and Accountability
Public institutions, local governments, and healthcare organizations rely on IT to deliver critical services to citizens. Downtime can result in disrupted access to vital systems, with reputational and operational consequences.
Unique Requirements:
- High availability of digital services (e.g., patient data, public portals)
- Compliance with security and transparency standards
- Cost control and optimization
How Monitoring Helps:
- Detects and prevents service degradation early
- Provides documentation for audits and compliance
- Helps justify IT budgets through data-backed reporting
Discover how Manchester University NHS Trust Foundation, one of the largest hospital groups in the UK, streamlined monitoring across 10 hospitals and improved healthcare IT efficiency with Centreon.
MSP Monitoring: Scaling Operations with Multi-Tenant Visibility
Managed Service Providers (MSPs) face unique monitoring challenges: managing a wide range of client environments while maintaining service quality and operational efficiency.
Key Pain Points:
- Diverse infrastructures and customer-specific requirements
- Tool sprawl and operational inefficiency
- SLA delivery and client reporting
Monitoring Platform Requirements:
- Multi-tenant dashboards
- Automation for onboarding and alerting
- API integrations for customer portals and ticketing systems
Learn how the MSP IT Soluções uses Centreon to accelerate the digital journey for Brazilian enterprises.
IT/OT Convergence: Bridging Industrial and Digital Systems
Industrial organizations are converging their IT (Information Technology) and OT (Operational Technology) systems to improve efficiency and resilience. This demands a monitoring platform that can oversee both digital infrastructure and physical systems.
Examples of OT Components:
- SCADA systems and PLCs (Programmable Logic Controllers)
- Industrial sensors and control panels
- Energy systems and production machinery
Benefits of Unified IT/OT Monitoring:
- End-to-end visibility across physical and digital flows
- Early detection of critical production issues
- Improved collaboration between IT and plant operations
Explore Centreon’s IT & OT monitoring use case and learn how Centreon supports IT and OT convergence with unified infrastructure monitoring.
Summary: Industry Use Cases Overview
| Industry | Main Challenges | Monitoring Benefits |
| Enterprises | Complexity, uptime, SLA delivery | Unified dashboards, centralized alerts, SLA and KPI reporting |
| Public Sector | Compliance, transparency, cost control | Reporting, real-time alerts, optimized resource use |
| MSPs | Multi-client environments, tool sprawl | Multi-tenant support, scalable automation, client SLA tracking |
| Industrial / OT | Bridging IT/OT, legacy equipment monitoring | Cross-environment visibility, incident prevention, digital continuity |
How IT Monitoring Works
Behind every real-time dashboard, proactive alert, and SLA report is a powerful engine that continuously collects, processes, and visualizes data across the IT ecosystem. Understanding how IT monitoring works helps organizations select the right tools, plan deployments, and align monitoring capabilities with business needs.
An effective monitoring platform must support diverse environments, scalable architectures, and real-time insights. Here’s how it all comes together.
Key Technical Components of IT Monitoring
Modern IT monitoring systems consist of several core elements working in sync:
1. Data Collection Layer
This layer gathers data from monitored resources using various techniques:
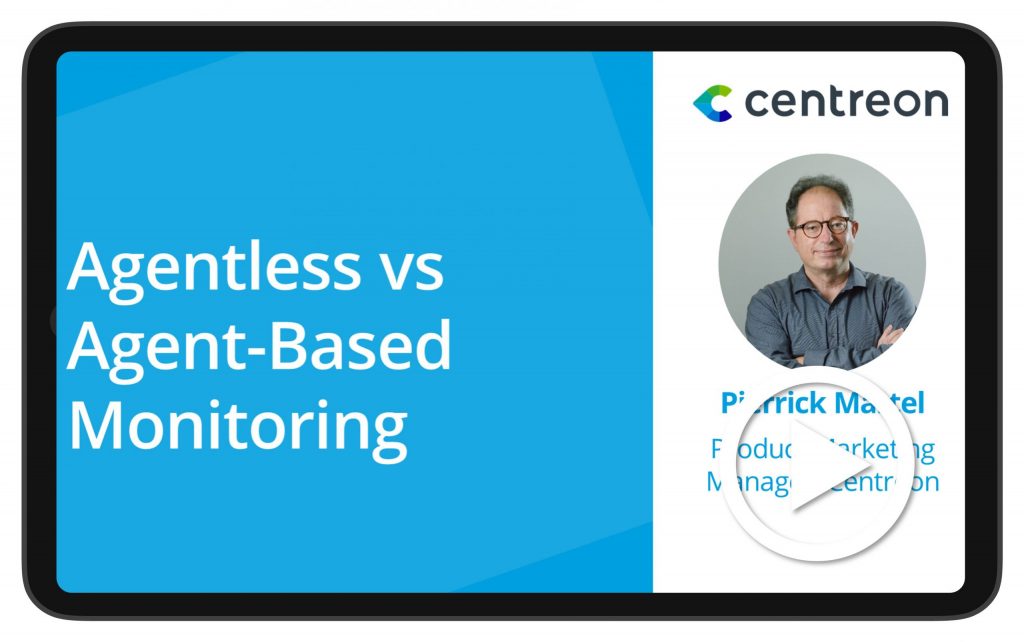
- Agent-based monitoring: Installed locally on systems to collect granular metrics
- Agentless monitoring: Uses protocols like SNMP, ICMP, SSH, WMI
- API-based collection: Pulls data from cloud services (AWS, Azure, GCP, Microsoft 365, etc.)
- Log collection: Captures and analyzes system, application, and security logs
- Synthetic monitoring: Simulates user actions to measure availability and performance
Centreon supports both agent and agentless methods, including cloud connectors.
Learn more with our video “Agentless vs Agent-Based Monitoring”.
2. Data Processing and Storage
Once collected, data is processed, aggregated, and stored for real-time and historical analysis.
- Thresholds are applied to determine the status of each component
- Events are correlated to suppress noise and surface root causes
- Time-series databases enable trend analysis and capacity planning
Smart filtering and deduplication reduce false positives and focus attention on critical issues.
3. Alerting Engine
The alerting system detects breaches of thresholds or service disruptions, and triggers notifications based on severity and context.
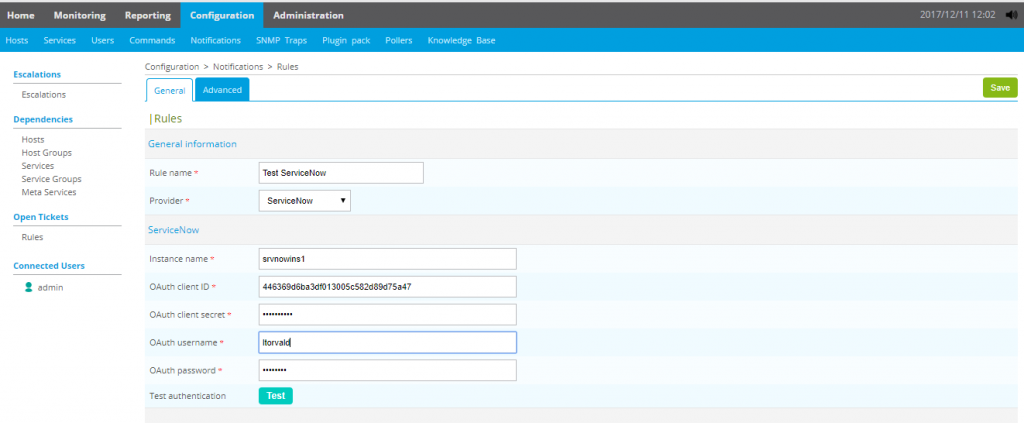
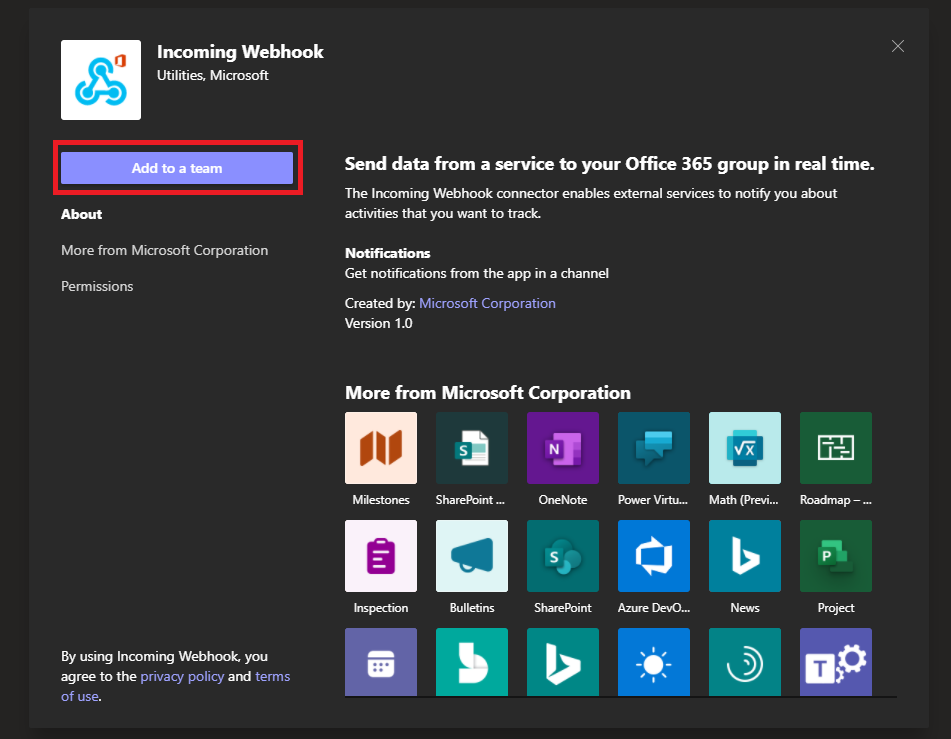
- Multi-channel alerts: email, SMS, webhook, third-party tools (e.g., ITSM)
- Escalation rules and incident routing
- Integration with automation and response workflows
Alerts must be fast, relevant, and actionable—otherwise they become noise.
4. Dashboards and Visualization
Data is transformed into meaningful insights through visual elements such as:
- Color-coded statuses (OK, warning, critical)
- Real-time graphs, heatmaps, and service maps
- Custom views by site, business unit, or application
- Historical performance trends for SLA tracking
Dashboards enable both technical and non-technical users to make informed decisions at a glance.
5. Reporting and Documentation
For compliance, SLA audits, and planning, IT monitoring platforms provide:
- Scheduled reports on availability, performance, and incidents
- Customizable templates per stakeholder (e.g., CIO, Ops Lead)
- CSV or PDF export for executive visibility
These reports are critical for justifying budgets, proving compliance, and guiding strategic investments.
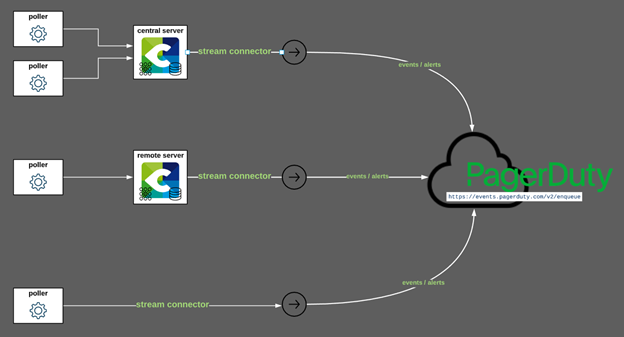
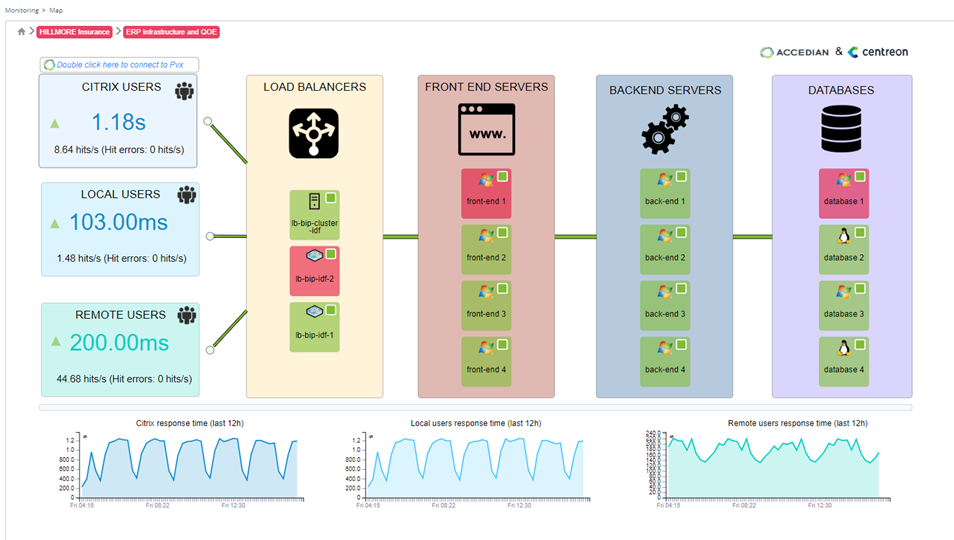
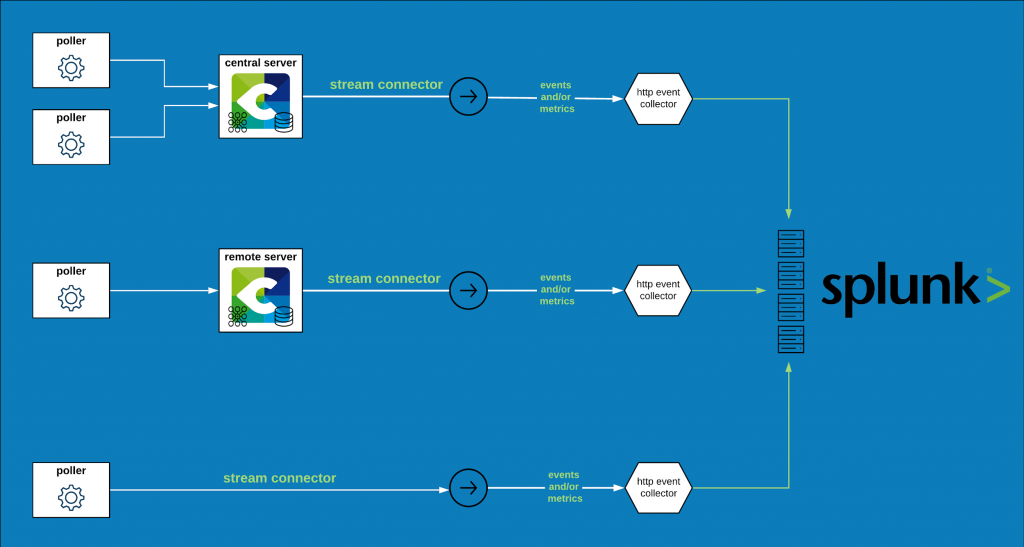
Typical Monitoring Architecture
Typical Monitoring Architecture
An IT monitoring platform typically follows a layered architecture, where each component has a specific role in collecting, processing, and presenting data.
Here’s how a typical monitoring flow works:
- Monitoring agents or connectors gather metrics and events from various infrastructure components—servers, applications, network devices, cloud services, etc. This can be done via agent-based, agentless, or API-based methods, depending on the environment and level of detail required.
- The data processing engine aggregates and analyzes incoming information. It applies thresholds, identifies anomalies, correlates related events, and stores historical data for trend analysis and reporting.
- The alerting system generates notifications when thresholds are breached or when performance indicators signal potential issues. Alerts can be escalated, suppressed, or routed to specific teams based on predefined rules.
- Dashboards and visualizations transform raw data into actionable insights. These interfaces provide IT teams with real-time views of system health, current alerts, and performance KPIs—customizable for different users or teams.
- Reporting modules support operational transparency, capacity planning, SLA validation, and executive decision-making. They allow organizations to document system availability, performance trends, and incident response over time.
This layered model enables scalability, reliability, and adaptability to both technical and business monitoring requirements. Whether your infrastructure is centralized, distributed, or hybrid, a well-designed monitoring architecture ensures no critical asset is left unmonitored.
Key Considerations When Designing a Monitoring Strategy
When planning or expanding your monitoring architecture, keep these best practices in mind:
- Define what matters: Identify mission-critical systems and SLAs to prioritize
- Start small and scale: Begin with core components, then expand coverage
- Use templates and connectors: Reduce setup time with prebuilt configurations
- Automate where possible: Trigger self-healing actions or ticket creation
- Maintain visibility: Avoid blind spots, even in remote sites or cloud zones
Explore Centreon’s extensive integration capabilities to ensure full visibility across your IT environment.
Summary Table: How IT Monitoring Works
| Component | Role in Monitoring |
| Data Collection | Captures metrics, logs, traces from all IT systems |
| Data Processing | Applies thresholds, correlates events, stores time-series data |
| Alerting Engine | Detects issues and triggers notifications based on severity |
| Dashboards | Presents status, trends, and performance insights in real time |
| Reporting | Documents availability, SLA compliance, and capacity metrics |
Together, these elements enable organizations to move from reactive firefighting to proactive optimization.
Key Features of an Effective Monitoring System
Not all monitoring tools are created equal. As IT environments become more distributed, dynamic, and mission-critical, organizations need solutions that go beyond basic uptime checks. A modern IT monitoring system must offer advanced capabilities to detect issues early, support decision-making, and ensure service continuity across all infrastructure layers.
Here are the must-have features of a high-performance monitoring platform.
Real-Time Data Collection
Monitoring begins with the continuous collection of performance and availability data across your infrastructure. A strong monitoring system supports:
- Multiple data sources: servers, cloud platforms, applications, containers, IoT, OT devices
- Agent and agentless methods: depending on system access, performance, and risk considerations
- Auto-discovery mechanisms: automatically detect new devices or services to reduce configuration time
See how Centreon’s auto-discovery and zero-config connectors simplify data collection across diverse environments.
Continuous Monitoring of Performance and Uptime
A robust platform tracks both the status and efficiency of every monitored component, ensuring optimal service delivery. This includes:
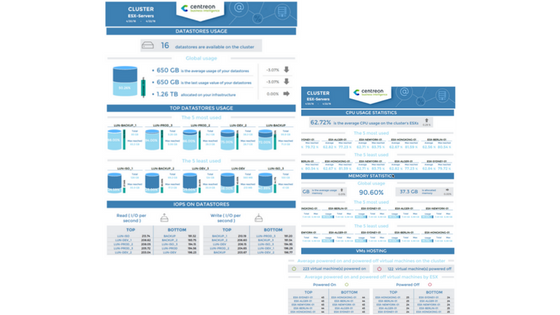
- Infrastructure health: CPU, memory, disk, bandwidth, I/O
- Application response times and error rates
- Cloud resource usage and latency
- SLA compliance metrics and thresholds
Monitoring must be continuous and granular, with historical data retained for trend analysis and capacity planning.
Real-Time Alert Management
Effective alerting is about more than just sending notifications—it’s about smart prioritization and noise reduction. Key alerting features include:
- Custom thresholds tailored to each service or device
- Multi-channel delivery (email, SMS, webhook, ITSM integration)
- Escalation policies based on severity and team availability
- Alert deduplication and suppression to avoid false positives
The goal is to detect issues quickly—without overwhelming teams with irrelevant alerts.
Unified, Shareable Dashboards
Dashboards are the nerve center of IT monitoring, providing real-time visualization of system health and performance KPIs. Modern dashboards should offer:
- Custom views per team, role, or business unit
- Real-time status indicators (color-coded, icon-based)
- Interactive charts and graphs to explore historical trends
- Integration of multiple data sources into a unified interface
Discover how Centreon’s dashboarding capabilities support both technical and strategic stakeholders.
Reporting and Analytics
Historical reports turn operational data into actionable insights. A good monitoring system includes:
- Prebuilt and custom report templates
- SLA tracking and service-level summaries
- Resource usage reports for capacity planning
- PDF/CSV exports and scheduled distribution
These reports are critical for IT managers, CIOs, and compliance teams alike.
Integration and Interoperability
Monitoring does not live in a vacuum. It should integrate seamlessly with your broader IT ecosystem:
- ITSM platforms (e.g., ServiceNow, Jira)
- CMDBs and automation tools
- Cloud services (e.g., AWS, Azure, GCP)
- Security systems (SIEM, firewalls, antivirus)
Open APIs and plugin frameworks enable maximum extensibility.
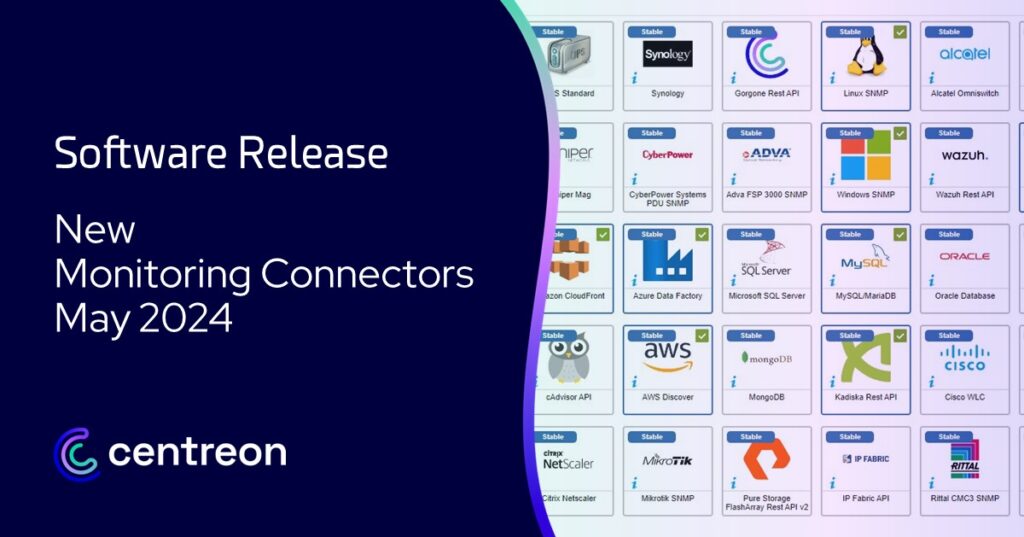
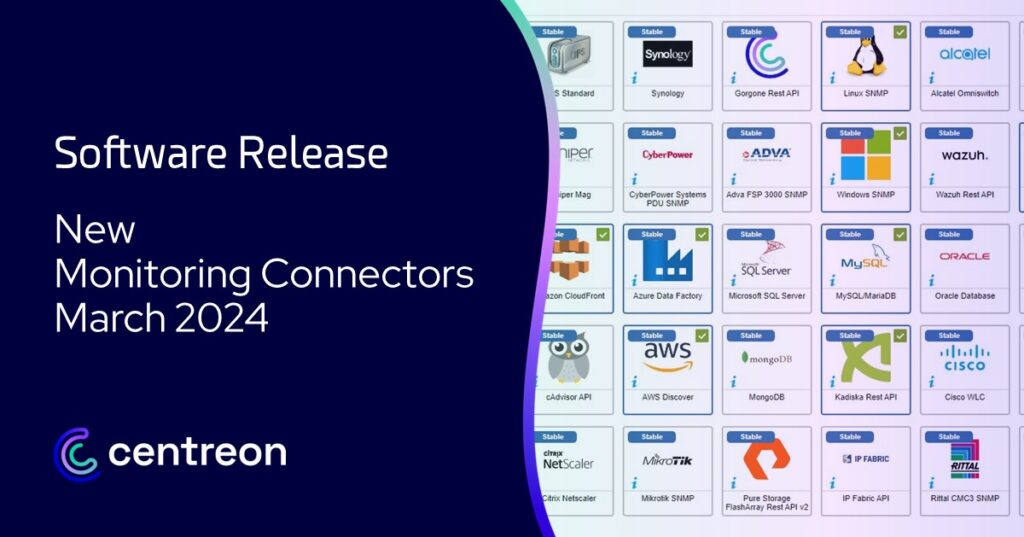
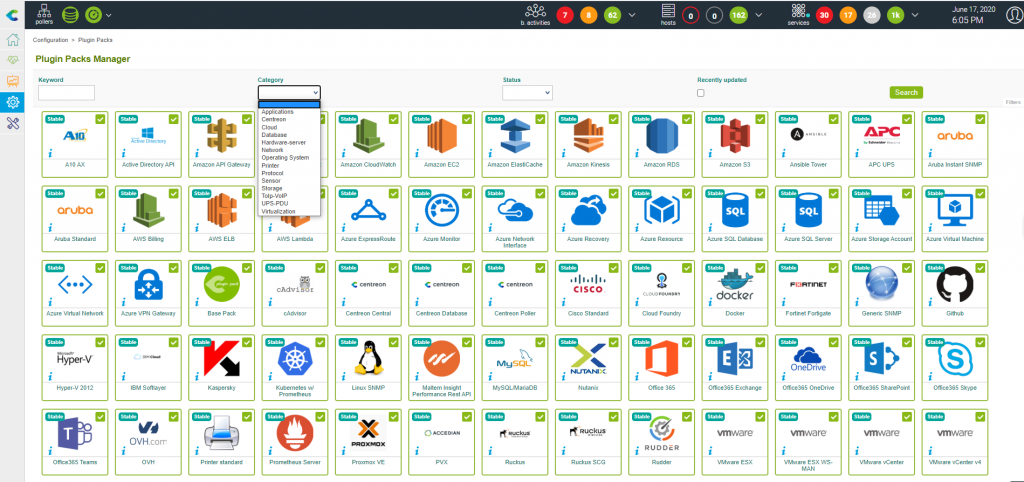
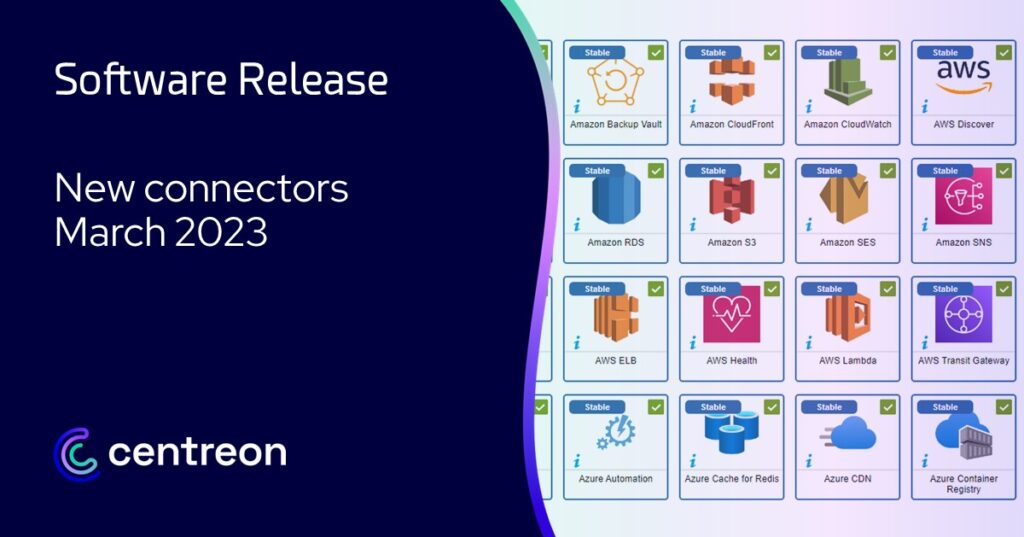
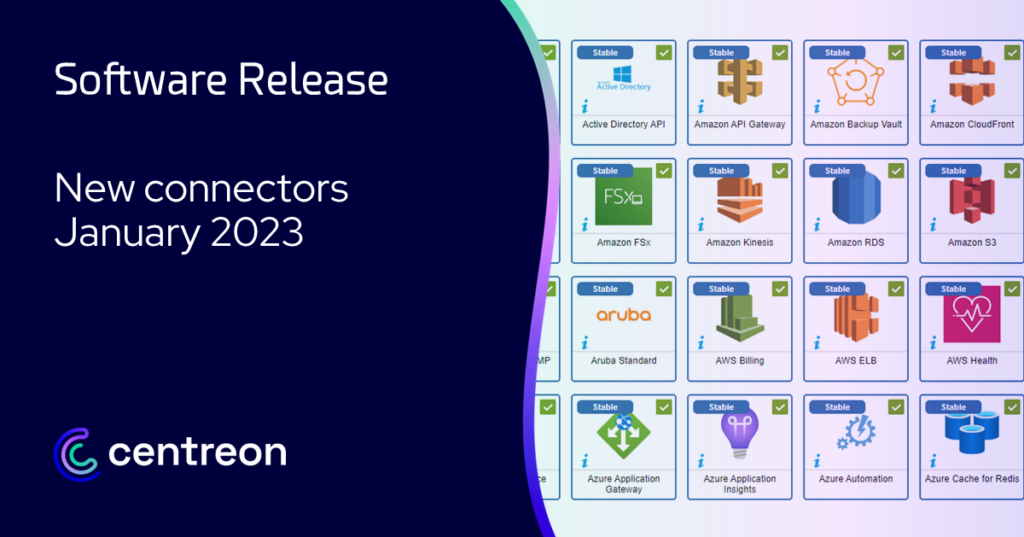
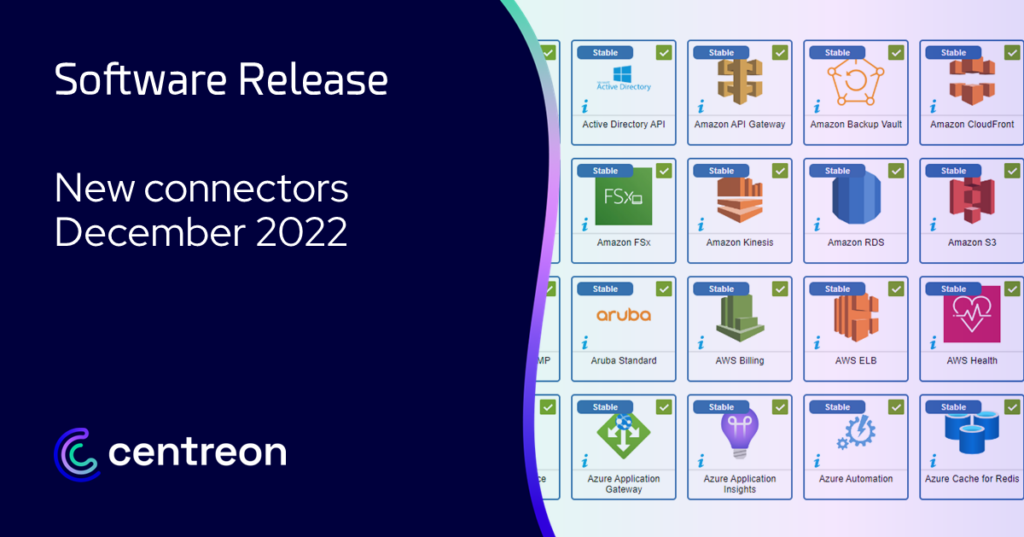
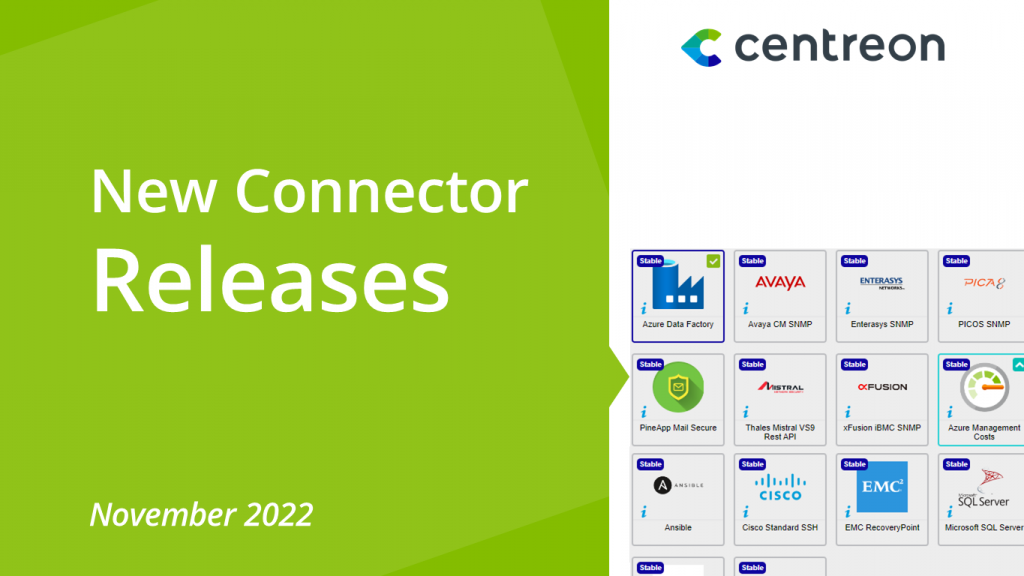
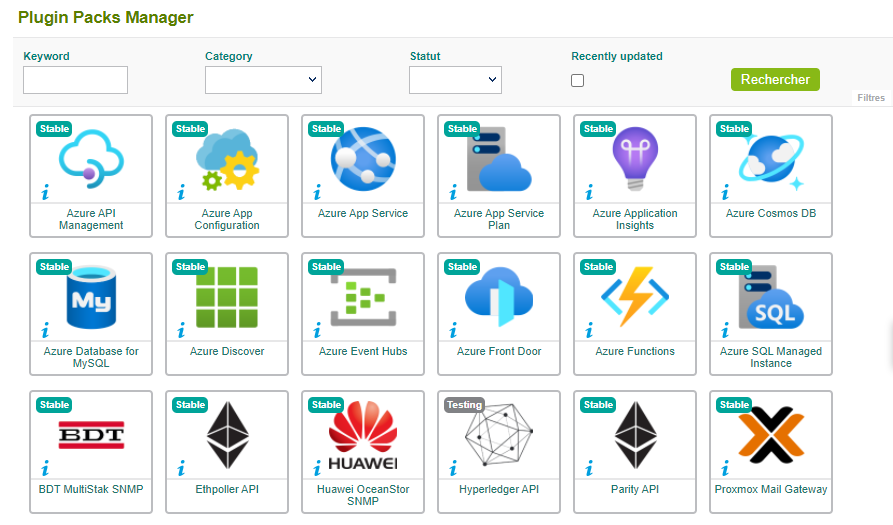
Centreon offers a broad integration catalog including 700+ ready-to-use connectors.
Open and Scalable Architecture
As IT systems evolve, your monitoring solution must scale with them. Look for platforms that are:
- Modular and open-source–friendly: for flexibility and cost control
- Cloud-native or hybrid-compatible: SaaS, on-prem, edge
- Capable of multi-site and multi-tenant deployment
A scalable platform future-proofs your monitoring investment.
Proactive and Predictive Capabilities
Advanced platforms use machine learning or behavioral analysis to detect issues before they impact users. Features may include:
- Anomaly detection using historical baselines
- Predictive alerts for capacity or performance degradation
- Automated incident correlation across systems
These capabilities shift monitoring from reactive to proactive IT operations.
Learn how Centreon supports AIOps-enabled monitoring for smarter incident response and prevention.
Feature Overview Table
| Feature Category | What It Delivers |
| Data Collection | Continuous, multi-source metric gathering |
| Performance Tracking | Real-time KPIs and historical trend analysis |
| Alert Management | Smart notifications, severity routing, noise suppression |
| Dashboards | Customizable, visual insights for all stakeholders |
| Reporting | SLA proof, compliance, resource forecasting |
| Integrations | Ecosystem alignment: cloud, ITSM, security, automation |
| Scalability | From small teams to multi-site global deployments |
| Proactive Capabilities | Anomaly detection, prediction, and intelligent event correlation |
Choosing the Right IT Monitoring Tool
Selecting the right IT monitoring tool is a strategic decision. The chosen platform must align with your organization’s technical requirements, business objectives, team capabilities, and long-term digital roadmap.
Whether you’re monitoring a single datacenter, a hybrid cloud deployment, or thousands of devices across the globe, your monitoring tool will directly impact uptime, operational efficiency, and IT alignment with business goals.
Types of IT Monitoring Tools
There are two main categories of monitoring tools available on the market:
1. Open Source Monitoring Tools
Examples: Centreon Open Source, Nagios, Zabbix
Advantages:
- No licensing fees
- High flexibility and customization
- Supported by active community ecosystems
Considerations:
- Requires technical expertise for configuration and maintenance
- May lack enterprise-grade support or turnkey features
Discover Centreon Open Source—a free edition with no time or device limits.
2. Commercial / Proprietary Monitoring Solutions
Examples: Centreon IT Edition, Datadog, SolarWinds, New Relic
Advantages:
- Preconfigured features and connectors
- Vendor support and SLAs
- Better suited for mission-critical, multi-site, or regulated environments
Considerations:
- Involves licensing and support costs
- Less flexible than open-source for some niche use cases
Centreon offers a hybrid model, combining open-source flexibility with enterprise-grade reliability and support across its editions.
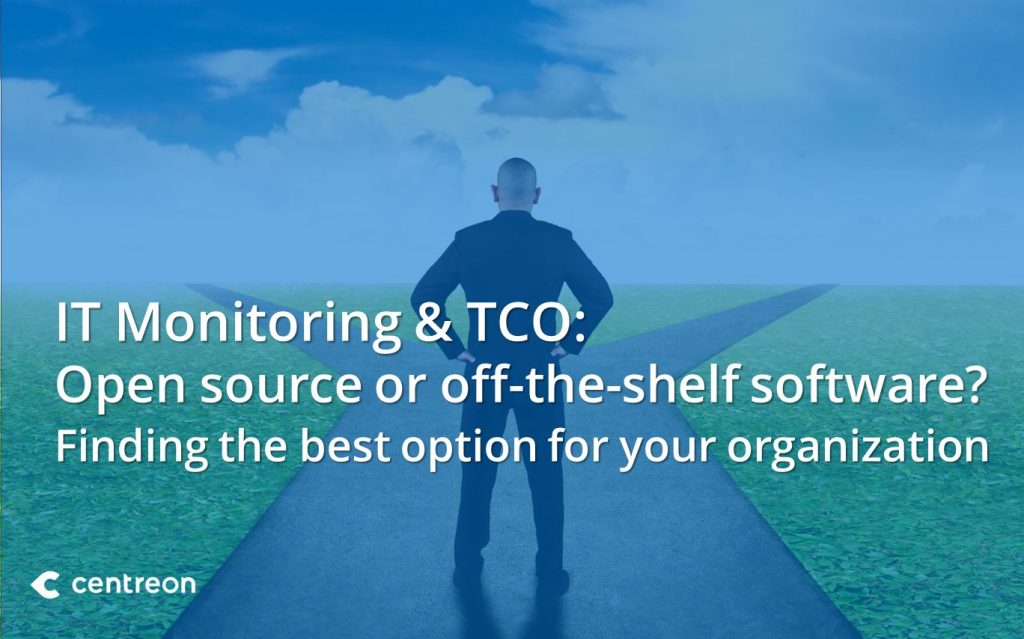
Looking to run a deeper analysis to decide between open source or paid IT monitoring? Download the Expert Insight, “IT Monitoring & TCO: Open source or off-the-shelf software? Finding the best option for your organization,” which looks at an IT monitoring solution type’s impact on the TCO, helping you opt for one that is perfectly adapted to your organization.
Key Criteria to Evaluate Monitoring Solutions
When choosing your monitoring platform, consider the following dimensions:
| Criterion | Why It Matters |
| Scope of Coverage | Can the tool monitor all infrastructure layers (IT, OT, cloud, apps)? |
| Ease of Deployment | How quickly can the solution be deployed and configured? |
| Interoperability | Does it integrate with your ITSM, CMDB, cloud, and automation stack? |
| Scalability | Can it grow with your infrastructure, across teams, sites, or clients? |
| Cost and TCO | What are the total acquisition, training, and maintenance costs? |
| Dashboards & Reports | Are insights actionable, visual, and shareable across the organization? |
| Automation & AIOps | Does it reduce manual workload and anticipate incidents? |
| Support & Community | Is there vendor support and a strong user community to rely on? |
Questions to Ask Before Making a Choice
- What systems, services, and environments do we need to monitor?
- Who will use the monitoring platform (Ops, DevOps, management)?
- Do we need to consolidate several tools into one platform?
- What level of customization and automation do we require?
- What is our tolerance for setup time and technical complexity?
Clarifying these points helps match your requirements to the right type of solution.
Centreon’s Value Proposition in the Monitoring Landscape
Centreon stands out by offering:
- A complete range of editions: from free, open-source to advanced enterprise and MSP-ready platforms
- Unified monitoring capabilities across cloud, hybrid, legacy, OT and IoT
- 700+ connectors for rapid deployment across multiple technologies
- Flexible deployment models: SaaS, self-hosted, hybrid
- Powerful dashboards, alerting, and automation features
- A vibrant user community and partner ecosystem (“The Watch”)
Compare Centreon’s editions and capabilities to find the one that matches your organization’s scale and needs.
Summary: Selecting the Right Tool
| Consideration | Open Source Tools | Commercial Solutions | Centreon’s Hybrid Model |
| Cost Efficiency | High | Medium to Low (depending) | Balanced (Open Source + Editions) |
| Feature Depth | Variable (custom-built) | High | High |
| Customization | High | Limited to APIs | High |
| Ease of Use | Moderate to low | High | High (out-of-the-box + flexibility) |
| Support Availability | Community-based | Vendor-backed | Both (Community + Enterprise SLA) |
By choosing a solution that balances scope, ease, and cost, you ensure your monitoring investment delivers measurable impact today—and scales tomorrow.
When it comes to IT monitoring, it’s not always easy to reconcile different expectations when you’re looking for advanced capabilities while your management and/or procurement department is more focused on cost… This peer-informed procurement guide “Aligning IT monitoring capabilities & budget using TCO” will help you to select the IT monitoring solution you need. Download the expert insight.
Emerging Trends in IT Monitoring
As digital ecosystems evolve, IT monitoring must keep pace with increasing complexity, volume of data, and the need for automation. The future of IT monitoring is shaped by three major trends:
- Observability
- AIOps (Artificial Intelligence for IT Operations)
- IT/OT Convergence
These developments are reshaping how organizations approach performance monitoring, incident response, and infrastructure optimization.
Observability: Beyond Traditional Monitoring
Observability extends monitoring capabilities by collecting and correlating a broader set of signals:
- Metrics: system and application performance indicators
- Logs: detailed records of system behavior and events
- Traces: distributed transaction tracking across services
Where monitoring answers “What is wrong?”, observability helps answer “Why is it wrong?”
Key Benefits of Observability:
- Faster root cause analysis
- Better understanding of complex, cloud-native systems
- Reduced mean time to resolution (MTTR)
- Support for microservices and containerized applications
Learn how Centreon supports observability practices.
AIOps: Smarter, Automated Monitoring
AIOps leverages artificial intelligence and machine learning to enhance IT operations. In monitoring, this means:
- Real-time anomaly detection based on historical baselines
- Noise reduction through intelligent correlation of events
- Predictive analytics to foresee degradations and prevent outages
- Suggested remediation based on incident patterns
AIOps transforms reactive operations into proactive and even autonomous processes.
Why AIOps Matters:
- Reduces the manual burden on IT teams
- Accelerates incident triage and resolution
- Improves reliability in large-scale environments
Explore how Centreon integrates with AIOps platforms and supports smart automation across IT workflows.
IT/OT Convergence: Unified Visibility Across Physical and Digital Domains
The line between Information Technology (IT) and Operational Technology (OT) is fading. Industrial systems (manufacturing, utilities, logistics) are increasingly connected to corporate IT networks.
This convergence requires monitoring platforms to:
- Cover legacy industrial devices (PLCs, SCADA, energy systems)
- Provide centralized oversight across both IT and OT infrastructures
- Support cross-team collaboration between IT and engineering
Monitoring both domains in a unified platform improves uptime, reduces siloed management, and strengthens security posture.
Read how Centreon addresses IT and OT convergence with tailored monitoring strategies.
Summary: Key Trends and Their Impact
| Trend | What It Brings to IT Monitoring |
| Observability | Deep system understanding, root cause analysis, cloud-native support |
| AIOps | Predictive detection, alert noise reduction, incident automation |
| IT/OT Convergence | Unified infrastructure visibility, enhanced collaboration, resilience |
These trends are not just “nice to have.” They are essential to maintain visibility, performance, and control in modern hybrid IT environments.
Integrations with Industry-Standard Tools
A modern software monitoring tool should never work in isolation. It should integrate seamlessly with your broader observability, analytics, and automation stack—offering a comprehensive solution that amplifies your existing IT operations strategy.
Two examples of popular integrations include:
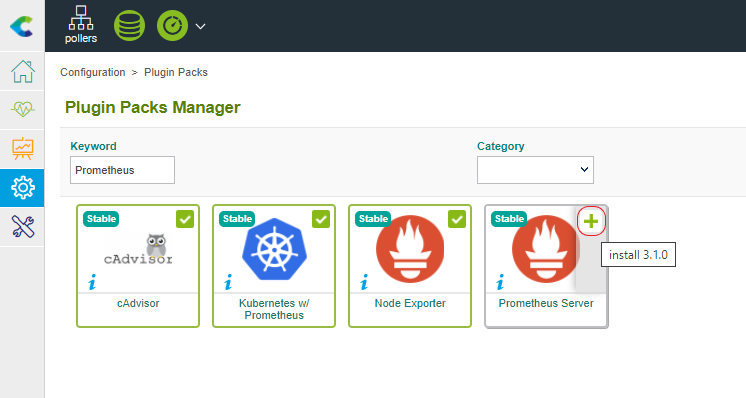
Prometheus
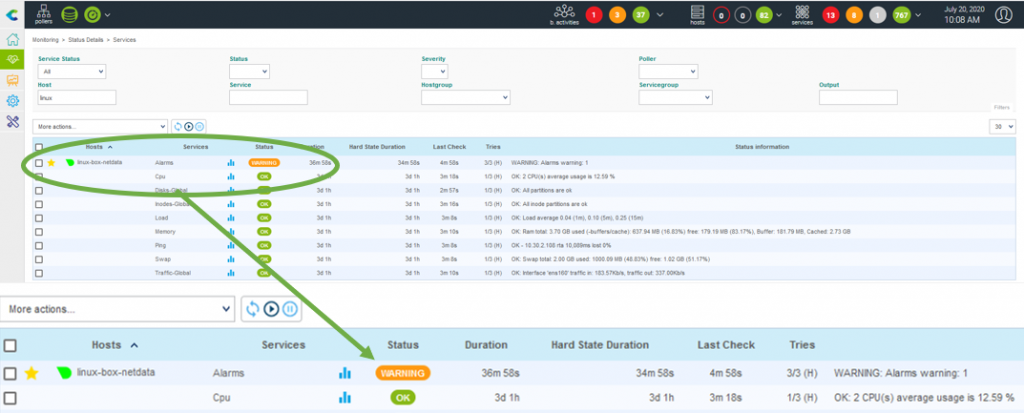
A leading open-source monitoring and alerting toolkit designed for time-series data—Prometheus is widely used in cloud-native environments. Centreon integrates with Prometheus to enrich infrastructure monitoring with telemetry data, offering a connected monitoring approach that combines depth and breadth.
Learn more: Interfacing Centreon with Prometheus
Splunk
Splunk specializes in log analytics and machine data. By integrating Centreon with Splunk, organizations gain real-time visibility into both performance metrics and unstructured log data—delivering a full-spectrum view of IT health, security, and service performance.
Learn more: Interfacing Centreon with Splunk
Together, these integrations help IT teams correlate monitoring alerts with deeper system insights, enabling faster root cause analysis and smarter decision-making.
Putting IT Monitoring into Practice with Centreon
Implementing an effective IT monitoring strategy requires more than just technology—it calls for a platform that adapts to your environment, supports your teams, and scales with your growth. Centreon provides a modular, open, and extensible platform that helps organizations put IT monitoring into action across all layers of infrastructure.
Whether you’re a Tech Lead looking to gain full visibility or an ITOps Manager focused on SLA delivery and optimization, Centreon offers a unified monitoring experience tailored to your needs.
Monitor Anything, Anywhere
Centreon supports comprehensive infrastructure monitoring across:
- On-premise, cloud, hybrid, and edge environments
- IT and OT components
- Networks, servers, containers, applications, and user experience
Its “Monitor Anything, Anywhere” philosophy enables organizations to cover 100% of their IT perimeter without blind spots.
Explore Centreon’s capabilities.
Flexible Editions for Every Stage
Centreon offers a range of product editions to match your technical scope and business priorities:
| Edition | Target Use Case | Key Features |
| Open Source | Teams seeking customization and cost efficiency | Core monitoring, community plugins, full control |
| IT Edition | Mid-sized IT departments needing scale and reliability | Ready-to-use connectors, dashboards, SLA reporting |
| Business Edition | Enterprises with multi-site or hybrid environments | Advanced automation, scalability, support, and business views |
| MSP Edition | Managed service providers managing multiple clients | Multi-tenant support, white-label dashboards, SLA reporting tools |
Compare all Centreon editions.
Key Capabilities That Support Unified Monitoring
Centreon brings together essential monitoring capabilities in a single platform:
- 700+ preconfigured connectors
- Integrated dashboards and SLA reporting
- Native integration with cloud platforms (AWS, Azure, GCP)
- Compatibility with ITSM, CMDB, automation tools
- AIOps and observability-ready architecture
- Real-time alerting, capacity planning, and business mapping
Dive into Centreon features for full visibility and operational control.
Learn from Real-World Monitoring Deployments
Organizations across industries use Centreon to monitor mission-critical systems:
- Retail: Monoprix monitors over 725 stores from a single console
- Healthcare: Manchester NHS Trust replaced multiple tools with a centralized platform
- MSP: ITS Integra oversees 25,000+ services across 300 clients
Explore Centreon user stories and real-life IT monitoring success cases.
Take the Next Step
If you’re ready to explore how unified IT monitoring can improve your infrastructure performance and operational efficiency:
- Request a Demo
See how Centreon helps organizations like yours monitor everything, everywhere—in real time. - Start a Free Trial
Experience Centreon’s cloud monitoring capabilities, or Centreon on-Prem with centreon IT Edition 100 to monitor to 100 devices with no time limit. - Contact Us
Speak with our experts to evaluate your current setup and explore tailored solutions.
FAQ – Frequently Asked Questions About IT Monitoring
What is IT monitoring?
IT monitoring refers to the continuous observation of an organization’s infrastructure to ensure optimal uptime, performance, and security. It includes monitoring systems, applications, networks, and services across physical and cloud environments.
What is IT service monitoring?
This focuses on tracking the availability and performance of complete IT services—not just technical components—to ensure they meet defined SLAs and business expectations.
What is monitoring in IT infrastructure?
Infrastructure monitoring targets the health and performance of hardware and foundational systems such as servers, storage, network devices, and virtualization platforms.
What is systems monitoring?
System monitoring refers to the tracking of servers (physical or virtual), operating systems, and core technical metrics like CPU usage, memory, disk I/O, and system load.
How is monitoring done?
Monitoring is done by collecting data (metrics, logs, traces) through agents, protocols (e.g., SNMP), APIs, or synthetic transactions. This data is analyzed, visualized in dashboards, and used to trigger alerts when anomalies are detected.
What are monitoring tools?
Monitoring tools are software solutions that provide the means to collect, analyze, and display IT performance data. Examples include Centreon, Zabbix, Prometheus, Datadog, and others.
Pages linked on this


Ready to see how Centreon can transform your business?
Keep informed on our latest news