


This is our second post about monitoring VMWare infrastructures. In how to monitor your VMWare infrastructure, published last Nov. 13th, we focused on how to use the Plugin Packs to easily collect data from your ESX servers and associated Datastores: at this stage, the Centreon monitoring console will list the real-time state of all hosts and services, showing any Warning or Critical alerts.
In this post we’ll show how Centreon EMS can help you make the most of all this monitoring data to get a clear picture of the overall health of your infrastructure, in real-time, or to plan for its usage. This in effect should allow you to easily and quickly answer the following questions:
- What is currently happening on my VMWare platform?
- Is my VMWare platform supporting the current load?
- What can I improve so the critical applications hosted on my VMWare infrastructure doesn’t encounter any risk?
- integrate new teams, new applications or new projects without any risk?
This will be done in two steps:
- Creating an VMWare health’s overview
- Analysing data using a synthetic capacity report
Keep an eye on your real time VMWare infrastructure’s health
Thanks to Centreon MAP, one of the main component available in Centreon EMS, you can create a synthetic overview and visualize all the indicators in a nice way. Using the view below, your IT team will be able to instantaneously understand what’s happening on your virtualization platform and take immediately the right decision to anticipate and solve incoming outage.
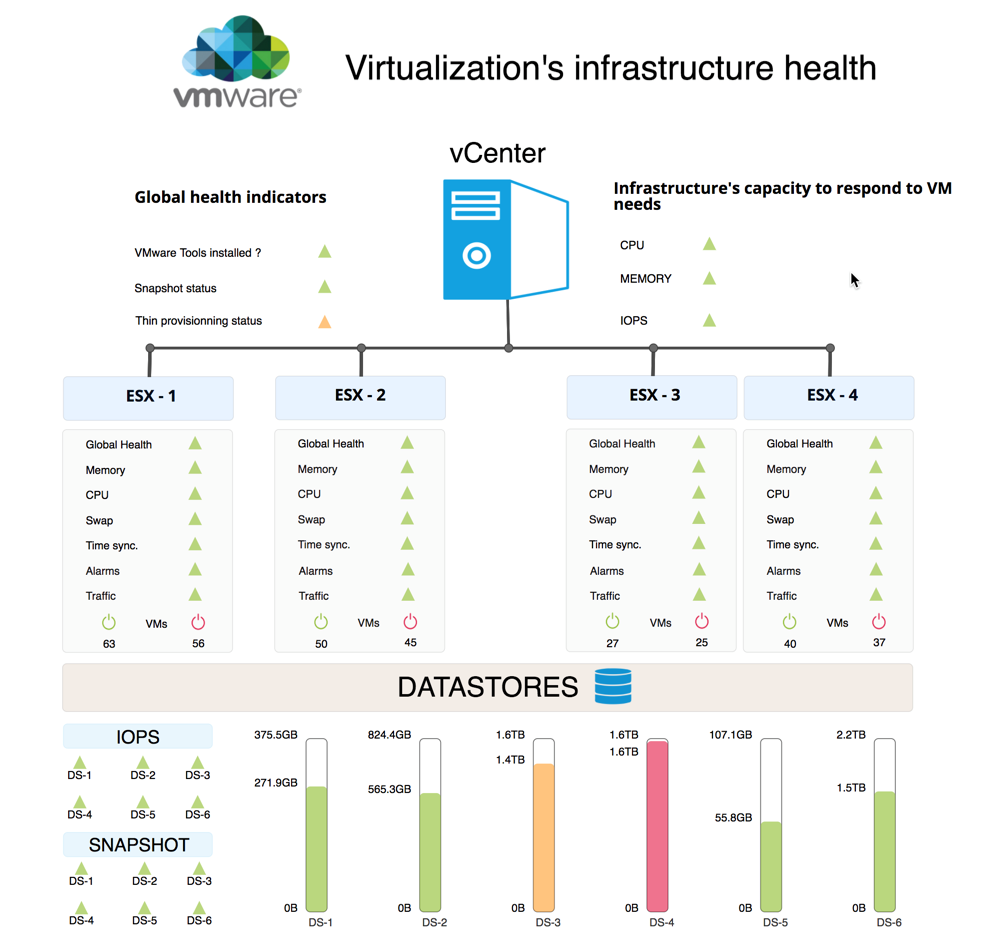
Example of a VMWare view created with Centreon MAP
This view contains all the following indicators, optimally organized:
- Global health indicators: VMWare tools installation, snapshots policy analysis, thin provisioning, cpu/memory/iops global virtual machine needs
- ESX health indicators: health, memory, cpu, swap, time synchronization, number of VM on or off, traffic usage for each interfaces
- Datastores used by all your infrastructure statistics: iops, size represented by the snapshot, used spaced
This view is an example of what can be done using indicators coming with Centreon VMWare Plugin Pack.It has been created using only standard Centreon and Centreon MAP objects.
In case your VMWare infrastructure is composed of tens of ESXs, hundreds of datastores, you should consider using Centreon groups instead of single indicators.
Feel free to create the view corresponding the best to your IT team’s needs.
Analyze, anticipate future needs & investment
We’ve taken some of the most important capacity indicators and aggregate them in a reports so you can analyze average usage and potential limitations of your VMWare infrastructure. You may schedule this report on a monthly bases to track major trends.
This report is divided into two pages, on the first page, you’ll have the following information:
- Storage spaces used, available and provisioned on datastores
- Storage: top and least used datastores
- IOPS: top and least used datastores
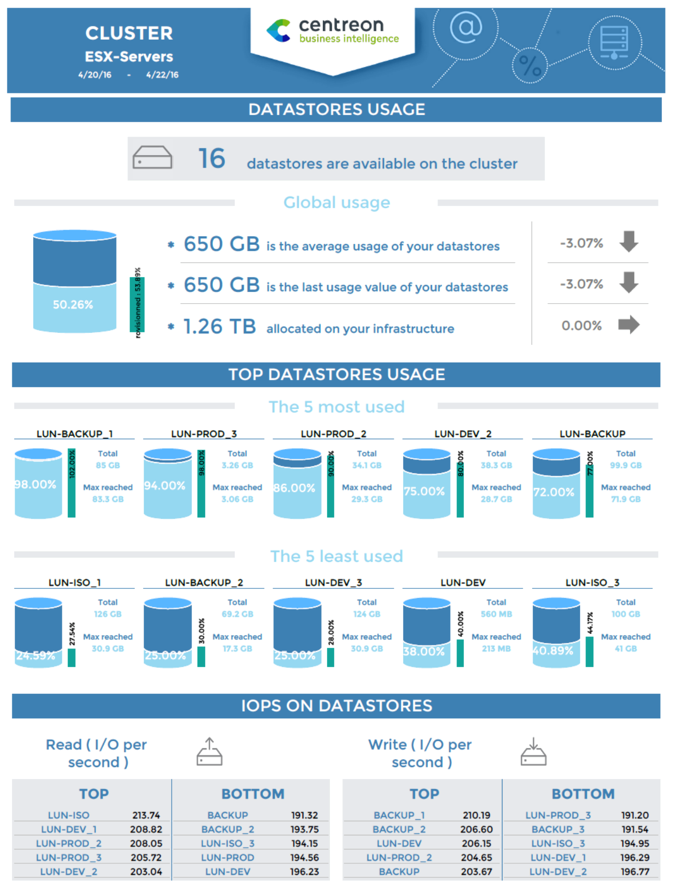
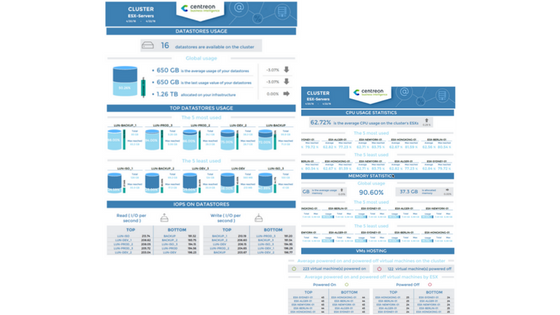
Centreon VMWare reports, datastore analysis (first page)
Then on the second page, you’ll have statistics about average cpu, memory and virtual machines hosting usage.
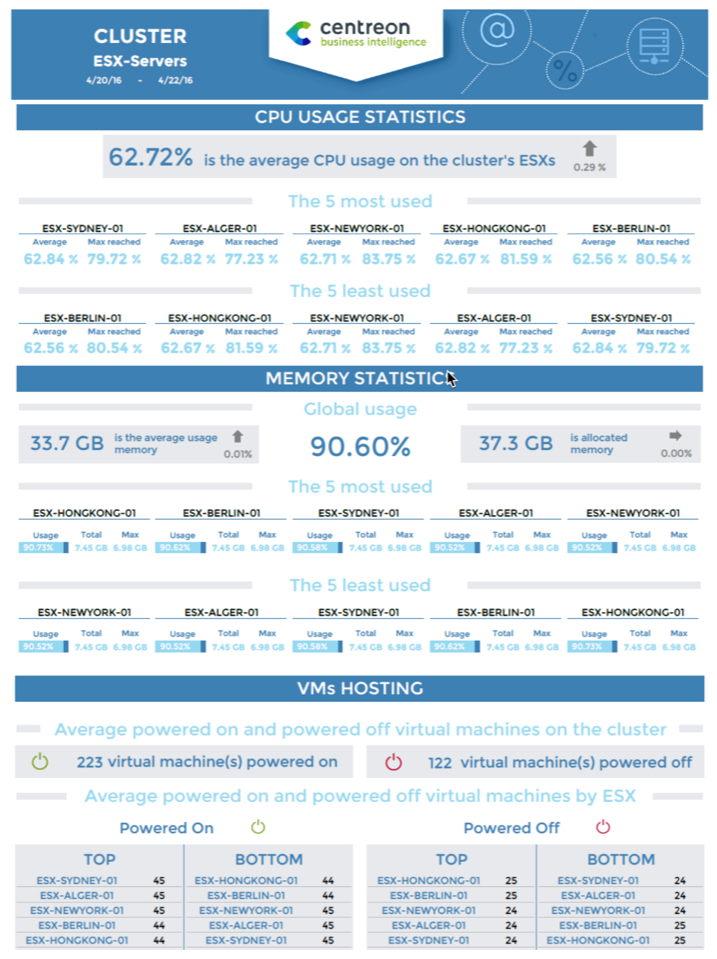
Centreon VMWare reports, ESX analysis (second page)
Thanks to Centreon MBI, included in Centreon EMS, you can simply extract these information by using the following report template. This VMWare report is included in our set of 30+ standard reports.
We hope this article helped you better understand two of the main Centreon EMS components. More generally, you may associate Centreon MAP and Centreon MBI to have a clear view on real time outage and better anticipate future needs.
If you want to know more about each indicator, you may be interested in our Plugin Packs’ catalog.
Would you like a personalized demonstration or to test the functionalities of Centreon EMS on your platform? Contact us and receive personalized assistance to ensure the success of your monitoring project.
Also read:
- Monitor your VMware infrastructure
- How Centreon EMS can help your ITOM teams to monitor infrastructure & IT services?
Share


