Centreon EMS offers a new feature to help IT service providers improve the reliability of critical systems and reduce recovery times in the event of a failure. The new features support their primary duty: maintaining the service level commitments made to their internal clients in terms of application availability.
For starters, this article will clarify the notions of reliability and maintainability, which are not to be confused. Then you’ll get a sneak peek at the three new widgets included in the latest version 3.2 of the Centreon MBI module — with some good graphs thrown in. This will be fun!
But let’s first agree on basic theory.
Service Reliability: SRE or ITIL—Cut from the Same Cloth
Recurring speakers at conferences like Monitorama Portland often cite their sacred texts: the SRE Book. Written by the engineers who invented the methods and systems that enable Google to successfully operate its huge infrastructure, the 550-page book which you can read for free, is about Site Reliability Engineering (SRE), or how to ensure the reliability of services delivered to customers (or end users), at the Google scale.
Traditional industries have their own scriptures to cherish, the ITIL repository, the reference for several decades now. Five volumes and nearly 2,000 pages list and detail a broad set of best practices in IT system management. Today, ITIL v3, which was published in 2007, is used all over the world. It is organized around five processes: strategy, design, transition, operation, and the continuous improvement of services.
Although these two approaches differ in form, they find common ground on some fundamental notions. First, on the ever-present necessity to align IT resources to business needs. Second, on guaranteeing service availability to the user. And last, on the fact that continuous improvement of availability rates can only be achieved if there are relevant indicators for both the service and the underlying infrastructure elements.
There, we said it: indicators. This is our cue to start discussing the concepts of reliability and maintainability.
A Party for Acronyms: MTBF, MTRS, MTBSI, MTTA
Let’s first introduce the new Centreon EMS widgets, as they have everything to do with reliability and maintainability. The widgets make it possible to visualize at a glance the least reliable resources, i.e. those that most often fail, as well as the resources that generate the most downtime. In other words, they help you monitor the resources that are the hardest to maintain, aka those requiring the longest recovery times.
In accomplishing their task, the widgets focus on two specific indicators that relate to reliability and maintainability, or to spell it out, mean time between failures (MTBF) and mean time to restore service (MTRS).
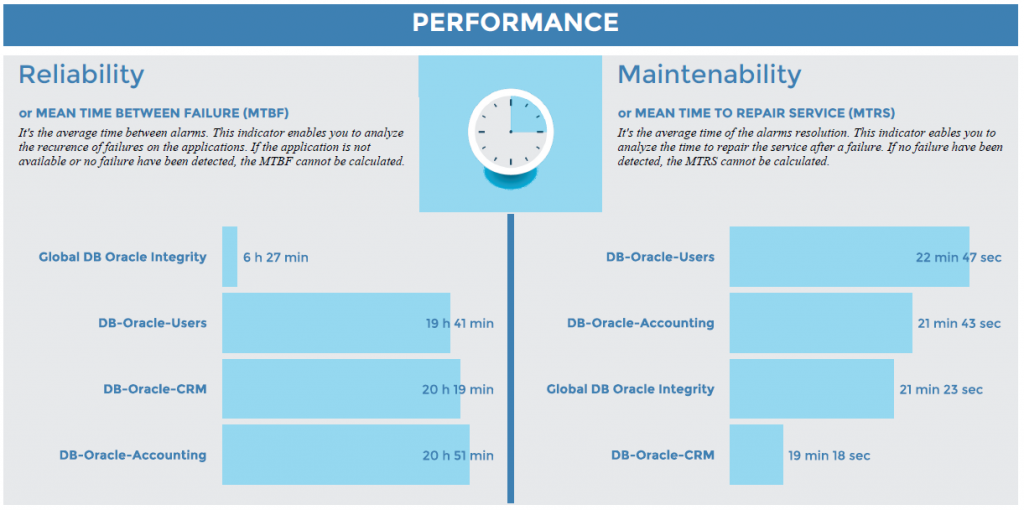
Let’s take a closer look with this small diagram:
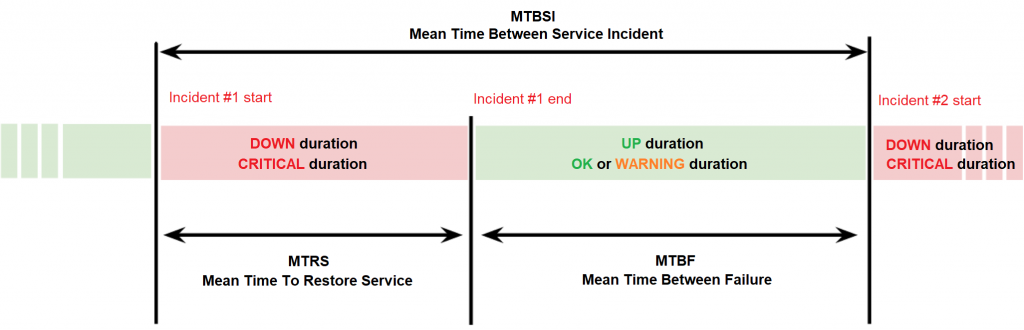
- MTBF(mean time between failures)This indicator relates to reliability: it measures the average time between the end of an incident and the beginning of the next. It should be as high as possible.
- MTRS (mean time to restore service)This indicator relates to maintainability: it measures the average time to restore service. It should be as low as possible.
The less frequently used MTBSI indicator (mean time between service incidents), which combines MTBF and MTRS indicators, is not yet supported by our widgets.
However, our widgets support an additional indicator:
- MTTA (mean time to acknowledge)This indicator relates to reactivity: it measures the average time between the beginning of the incident and the time by which operation teams realize it’s there (acknowledge status). It is often used to measure the responsiveness of level 1 support teams, especially if they’re outsourced.
You’ll find this diagram and more definitions of basic concepts in the online documentation of the Centreon MBI module, in the User Guide section.
Centreon MBI: Reports and Widgets for Custom Views
In the Centreon EMS solution, MBI is the decision support module that streamlines the long-term management of your IT infrastructure.
In particular, Centreon MBI is responsible for the automatic generation and distribution of over 40 consolidated report templates, all within the ITIL framework, to manage capacity, availability, service levels, and performance.
Centreon MBI also offers many widgets which can be displayed in Custom Views.
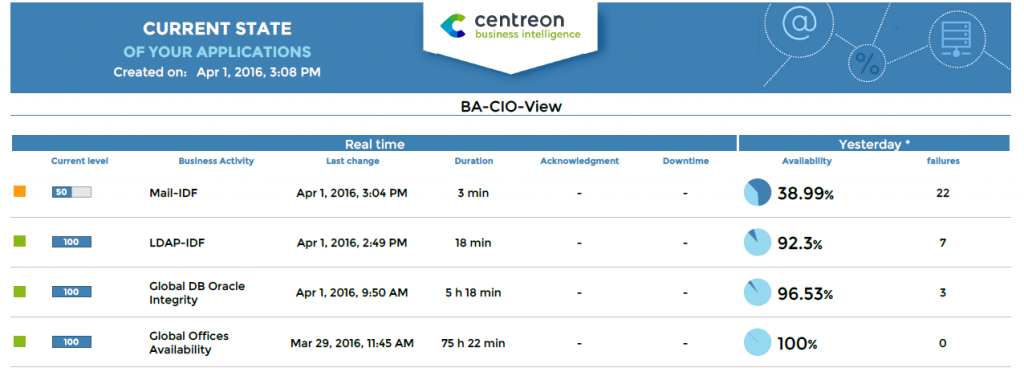
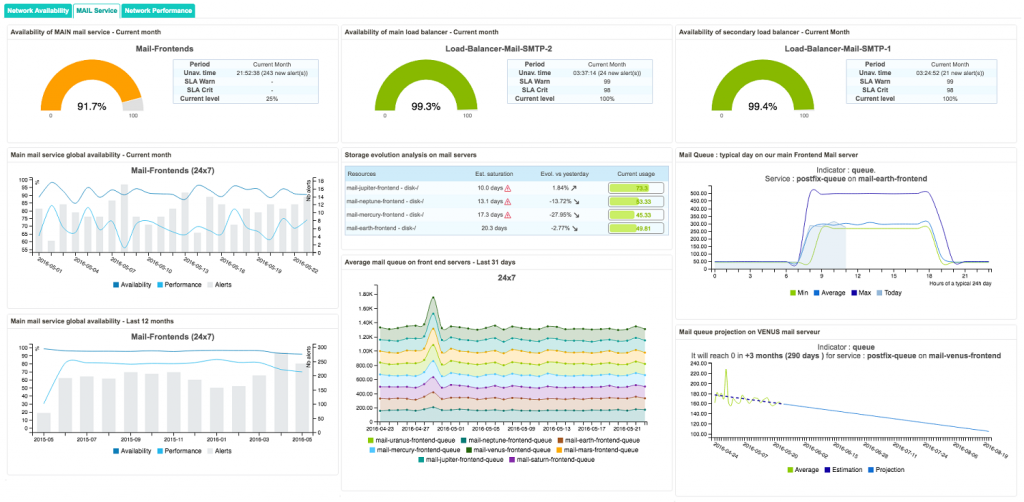
Wondering what Custom Views are? They’re Centreon EMS’ real-time customizable dashboards. Built from a selection of 30 customizable widgets, they let you combine real time data with aggregated data, providing a single view of a critical application’s full operating context. You get to see both what is happening now and what has happened over the last week or within the current month.
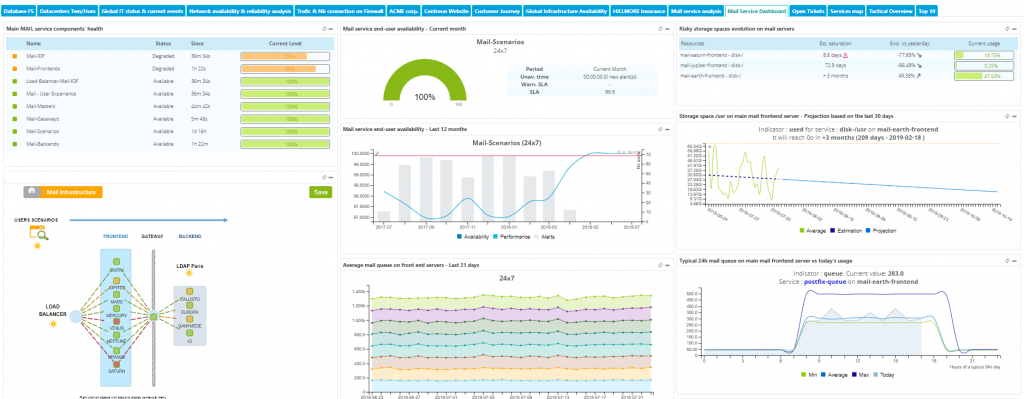
Custom View Sample
In the latest MBI module 3.2 version, you’ll find three new widgets to include in your Custom Views:
- Application reliability and maintainability
- Host reliability and maintainability
- Services reliabilityand maintainability
1. Application Reliability and Maintainability
The “Business Application MTBF and MTRS” widget lets you visualize the reliability and maintainability of a set of applications modeled using the Centreon BAM module.
For each modeled application, the widget displays both the MTBF and MTRS indicators, as well as four additional pieces of information: the real-time status of the application and the time elapsed since the last status change, its availability rate, and the number of critical events over the period.
As always, this widget is configurable. For example, you can determine the period of time you wish to monitor (current year, last 6 months or last 12 months) and the columns you want displayed.
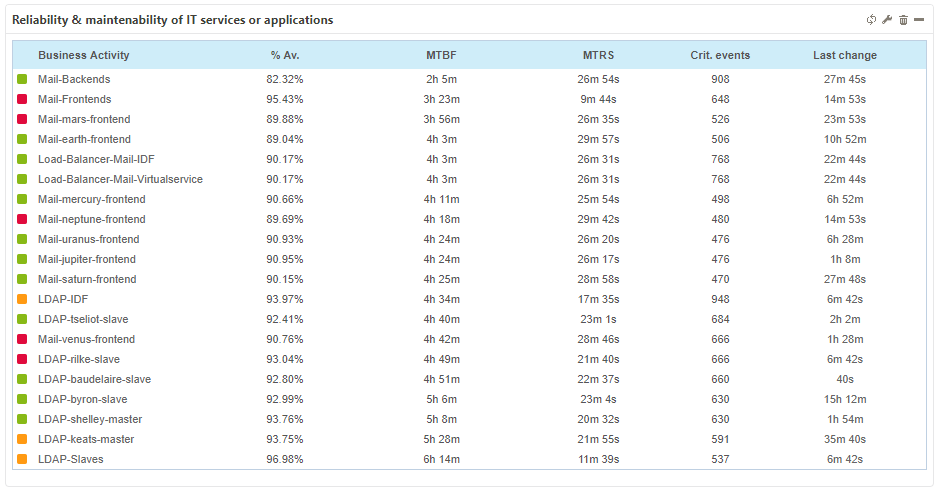
You were, and still can get this information through the template BusinessView-BusinessActivities-Availabilities-1. On its first page, the same indicators on reliability and maintainability of applications are displayed.
2. Host Reliability and Maintainability
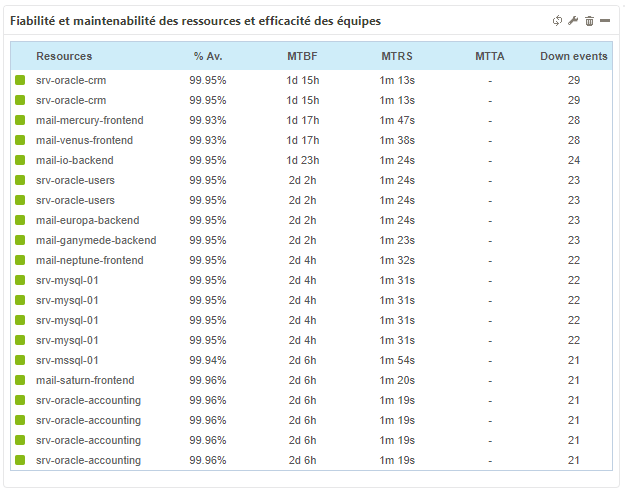
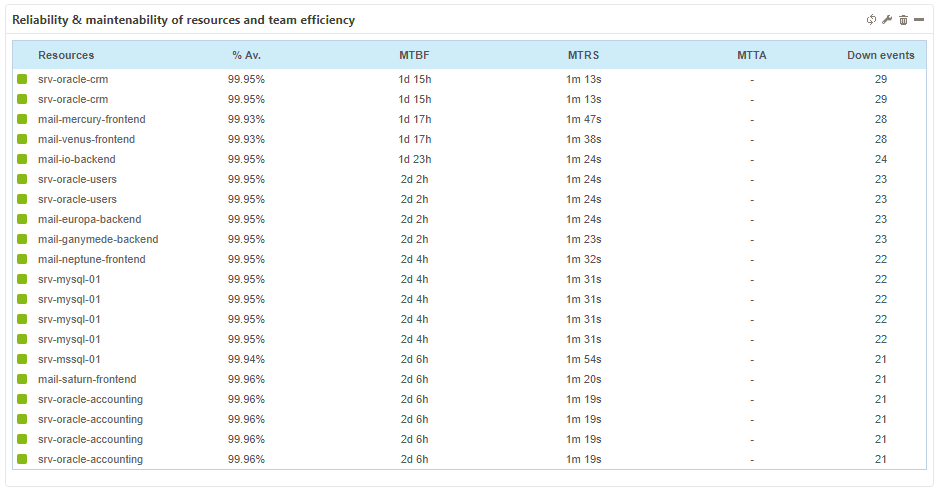
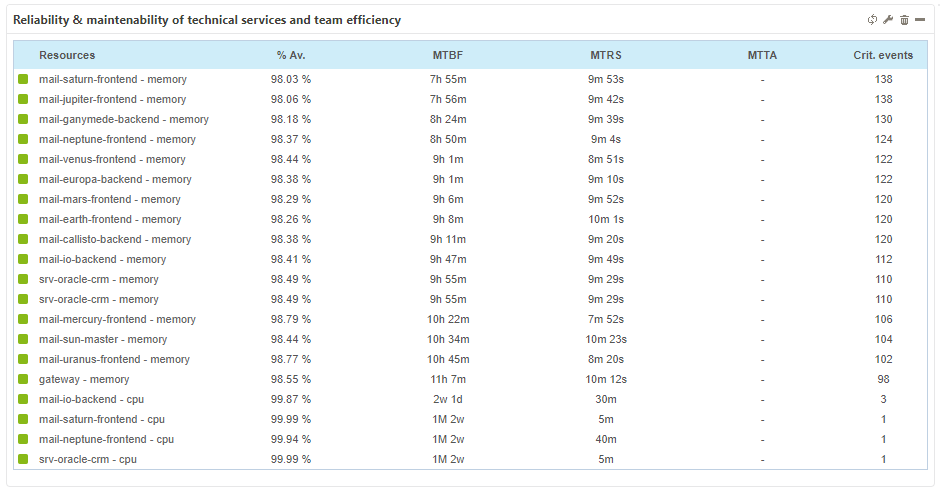
The “MTBF and MTRS per host” widget allows to visualize the reliability and maintainability of a list of hosts supervised by Centreon EMS.
You get a view on the MTBF and MTRS columns. Good to know: you get to decide from which of these two columns you will be sorting the information, if you’d like to prioritize the less reliable and most difficult to maintain hosts, for example. And it’s not an either/or option: you may also build a Custom View that displays twice the same widget, with the columns sorted to provide different lists. This is true for all three widgets.
The rest of the information displayed includes real-time status, availability rate, number of events, and an MTTA column measuring the average responsiveness of the support teams.
Remember this information is also available through the Hostgroups-Incidents-1 report template. The first page of this report displays the evolution of the alerts on the hosts, organized per criteria defined in Centreon (technology, criticality, customers, teams, etc.).
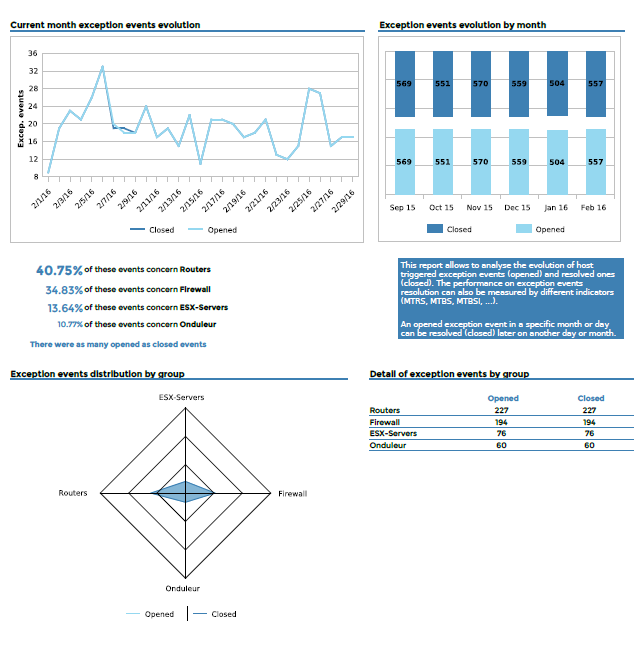
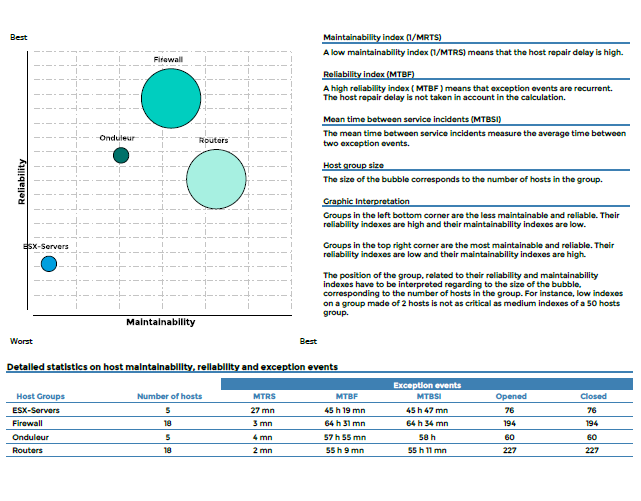
On the second page of the report, reliability (MTBF) and maintainability (MTRS) indicators are aggregated so you can quickly detect problems on sets of hosts.
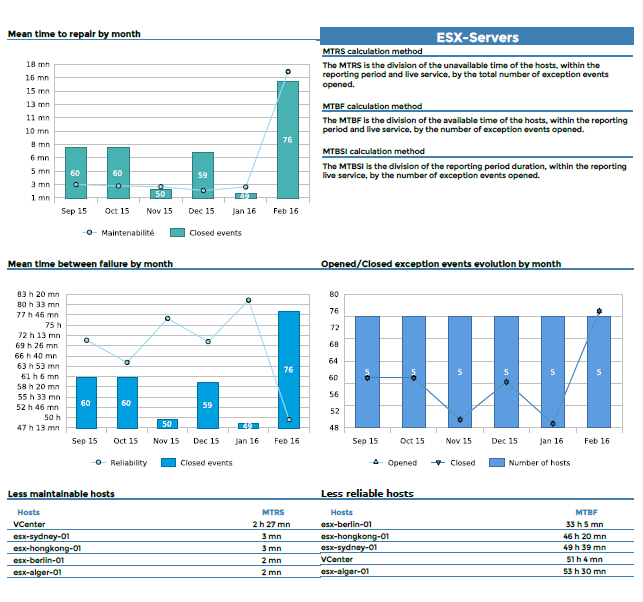
 Finally, for each grouping (group of hosts), a detail page is available, highlighting the evolution of alerts and processing times and providing a list of least reliable hosts and longest to restore hosts.
3. Service Reliability and Maintainability
The “Service MTBF and MTRS” widget lets you display a list of the services that are the least reliable or that take the longest to restore, for a given period, very similarly to what you can do with the host widget.
In a Nutshell
Whether you’re an ITIL v3 buff, a SRE Book convert or a pragmatic veteran that has seen it all, helping your organization align IT resources with business needs will confront you to the same inescapable reality. You need to keep an eye on those indicators that can enhance decision-making. It’s an important step to enabling the continuous improvement of your IT system on two fronts, the reliability of its crucial components and the swift restoration of service after a failure.
Centreon EMS was already helping you track these essential indicators through its reporting templates, which are typically used to feed monthly or semiannual steering meetings.
With the new 3.2 version of the MBI module, the same indicators are now conveniently offered within the web dashboards. These Custom Views provide a comprehensive glance at all the information you need for the day-to-day management of each of your business applications and their underlying infrastructure elements.
This furthers the primary mission of Centreon EMS: providing you with a complete IT monitoring solution to view and share information throughout the IT department, reinforcing alignment with business needs. Let us know what you think of those widgets!
More New Features and Improvements
There are more features and improvements to discover in the new MBI 3.2 version. See all in the release note.
Share