The digital revolution has resulted in Business management having massively computerized tools to work with, leading to a large number of questions on a daily basis. How can these users get the answers to questions on subjects as essential as CRM availability or the availability of their emails? How can your monitoring indicators be used to give an application-oriented view? The answers from Etienne Gautier.
The Centreon blog. Why produce Business indicators when we already have monitoring indicators?
Etienne Gautier. Companies are giving their business teams an increasing number of digital tools. These solutions generate higher productivity but also questions from users who need to know about the availability and performances of these applications.
IT departments have this information, the only problem is that the data is unusable by people who don’t have a technical background. These users want accurate information that they can understand at a glance, based on their daily usage. Raw monitoring data can’t provide that. We therefore need to speak their language and produce Business indicators that any user can understand.
These indicators shouldn’t just inform about application availability, they should also provide information about the solution’s performances throughout the Business process.
Let’s take the example of an e-commerce web site. It’s certainly nice to know that the home page is accessible, but it’s essential for webmasters or product managers to be able to monitor the purchasing workflow from the start to the end of the customer experience. If the home page is perfect but customers are having trouble paying (too slow, malfunctions, errors, etc.) then we can consider the service to be downgraded, or even unusable by increasingly demanding visitors.
TCB. What can you do to switch from a technical to an application-based view?
EG. This requires new, higher level, indicators which can be combined to answer a business question. Let’s look at the e-commerce web site again. The question that needs to be answered is: “Can my customers pay for their purchases?” and not “can the home page be accessed?”. Materially, it’s easy to read a URL, identifying a business issue on an e-commerce web site is another kettle of fish. Here we need considerable finesse to set up these indicators which are there to describe the application and replicate its operating logic. Using a large amount of data (technical and raw), high level indicators need to be created to give a view of the business process as close to usage as possible. You also have to share them. This can be done using a highly visual cockpit on a big screen or on an intranet for example.
TCB. That’s all very well, but what tools can I use to create these “high level indicators”?
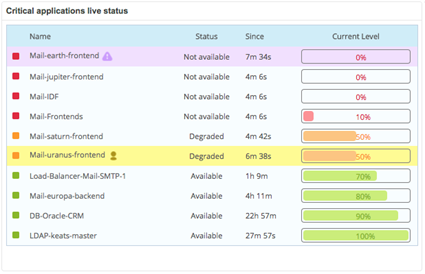
EG. At least a fully functioning brain and a BAM (Business Activity Monitoring) tool! The fully functioning brain will help you model the application. Then Centreon BAM will help you aggregate raw monitoring indicators and convert them into Business indicators using a rule to create a macro-view. In fact, you use data from the network and the server to create new application-oriented indicators.
It’s always easier to interpret a red or a green square on a screen than to read a computer print-out. So the ideal solution is to combine the BAM solution with a display tool like Centreon MAP to model the business indicators and make them more “sexy”.
Business intelligence can also be built in (Centreon MBI) to create availability reports, to assess availability and/or performance levels of an application over a given period in time.
Indicators should be defined jointly with Business from the design phase and should be capable of answering questions that are as simple as “is my email working today?” or “Why is the CRM so sluggish?”.
This requires good knowledge of the application and how it’s used, working jointly with the application manager, modeling the functions and then setting up an extra level of monitoring.
Creating business indicators and making them available are high value added services for users, making this a fully-fledged monitoring project.
TCB. An application-oriented view is a real benefit for Business teams. But what about for IT departments?
EG. I’m tempted to say that it’s 100% benefit for them too! Firstly, these indicators make it possible to anticipate Business teams’ needs and increase their trust in IT. The IT Department isn’t considered as just a delivery service any more, it becomes a source of added value for the Business teams who also have services that save them time.
It’s also an excellent continuous improvement tool. Although indicators provide information about application availability or performance, they don’t tell you anything about user satisfaction levels. An indicator may be green, but dissatisfied users could be calling anyway. By publishing Business indicators, you benefit from user feedback which allows you to effectively review the indicators and improve your monitoring quality. By creating reports that can be used to analyze performance data, the IT Department also gives itself the means to identify resource optimization levers. This information is very useful in situations where infrastructure is increasingly hybrid (between virtualization and the cloud) and requires resources to be provided on demand.
As a result, the services provided by the IT Department are better identified, its mission is highlighted and communications with Business and senior management become easier. Once they have their confidence back, IT departments are able to pursue their company’s digital transformation with peace of mind.
⇨ More information on Centreon BAM and Centreon MBI

Etienne Gautier – Product Manager
Joining Centreon in 2011 as a Business Intelligence engineer to work on Centreon MBI as a consultant & developper, Etienne worked closely with customers and built a high expertise on Centreon data analysis. Armed with this experience, he then became product manager in 2016. He’s now in charge of Centreon commercial softwares: Centreon MAP, Centreon BAM & Centreon MBI and strongly committed in customers’ success.


