


Integration of Accedian’s SkyLIGHTTM PVX NAPM solution into Centreon
What would you rather know?
- That your organization’s infrastructure is running normally? Or
- That users are experiencing a productive day thanks to optimally delivered IT service?
If your answer is “Give me both,” you’ll be thrilled to learn that Centreon EMS is now providing unprecedented insights into Network & Application Performance Monitoring (NAPM) and end-user experience through the integration of Accedian’s SkyLIGHTTM PVX NAPM solution into the monitoring platform. You won’t have to choose between views anymore—you’ll get to see both what’s going on above and below deck—making your IT monitoring journey and the broader IT experience in your organization a much smoother sail. Read this post if you’ve been trying to reconcile views on what’s going on at the infrastructure level with the experience enjoyed by the users at the edge of the system. You can also ask us to tell you more about it.
“An emerging ITOps challenge is protecting SLA compliance and improving IT service resilience as business applications rely on an ever-increasing number of IT domains. Centreon EMS collects and combines metrics into complete views.”
The news in a nutshell: NAPM Visibility Through Centreon EMS
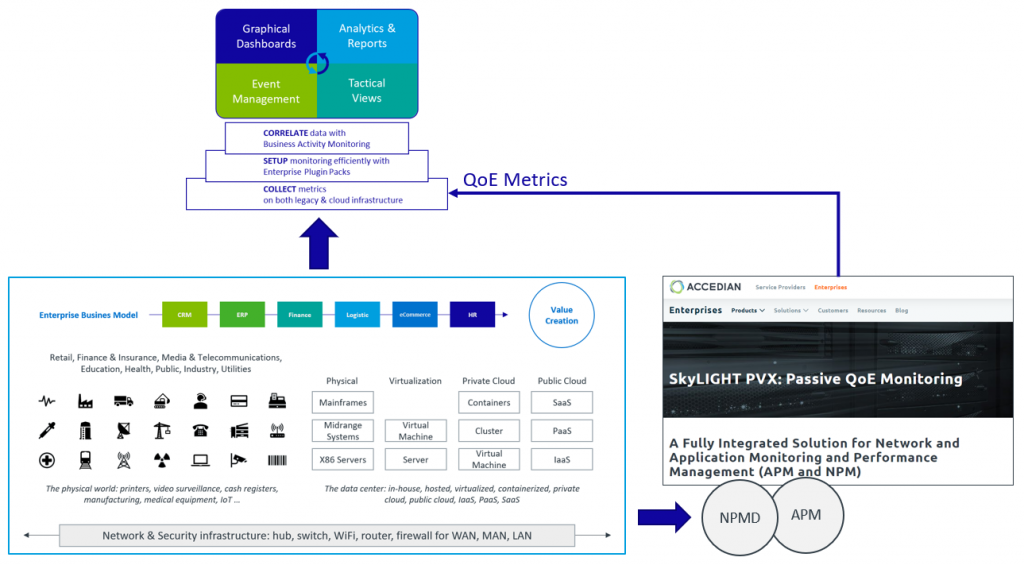
Centreon’s approach to IT monitoring rests on integration. We believe ITOps should be able to interconnect the tools the organization is using to make sure the entire IT ecosystem works optimally. We also want to make this process as easy, streamlined and productive as possible. This new integration results of a technological alliance with global network and application performance monitoring (NAPM) expert Accedian, and the goal is to deliver end user experience visibility for ITOps. Concretely, it means that you can now collect and integrate into your Centreon EMS platform user experience data from the NAPM solution SkyLIGHT PVX.
Why It Matters to You: Optimal Business Application Delivery & Easier SLA Compliance
Keeping an eye on user experience data is an excellent tactic for IT teams looking to reduce service degradation risks and improve resolution times for optimal service delivery of business-critical applications. It’s also your ticket to keeping track of SLA compliance. Combining both the infrastructure and the user perspectives will deliver telling insights into how infrastructure and applicative layers impact actual, real-time experience of users, and ultimately business front lines.
What You Can Do: Leveraging SkyLIGHT PVX from the Centreon EMS Platform
SkyLIGHT PVX delivers unified performance monitoring visibility up and down the entire application chain and across the network, with best-in-class resolution and velocity. With Centreon EMS, ITOps are able to:
- Instantly retrieve key user experience metrics, e.g. network latency, application response or transaction performance, mapped to infrastructure availability and performance indicators in real time on a user-friendly dashboard.
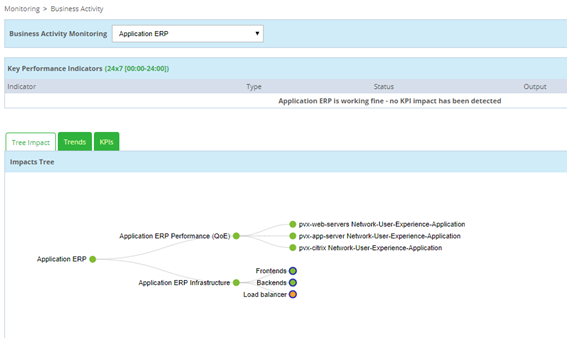
- Implement business application service maps, aggregating end user experience with infrastructure metrics to produce a correlated picture that can be drilled down to identify the root cause.
- Generate end user experience-aware reports about SLA compliance, MTBF (mean time between failures), MTTR (mean time to resolution), and critical business operation metrics, which can further feed SkyLIGHT PVX’s business analytics for faster and smarter remediation.
Want to see rather than read about it? Contact us to get a quick demo.
A New Focus on Performance and end user experience for ITOM
Digital transformation is on everyone’s radar these days, meaning a lot of new tools and applications are entering the IT ecosystem. If you’re too tool focused, it’s easy to forget that the true raison d’être of the DX transformation is improving customer experience. These days, exceptional customer journeys start at the level of the business applications—which themselves rely on your complex IT system. As enterprises are trying to build some end user experience awareness into their monitoring console, they need full context on the performance of their critical business applications, both from the perspective of the end users and from the perspective of the IT infrastructure that supports these applications.
A Recipe for ITOM Integration
ITOM organizations typically use a combination of three tools to monitor their IT system:
- NPMD solutions: Network Performance Monitoring and Diagnostic
- ITIM solutions: IT Infrastructure Monitoring
- APM solutions: Application Performance Monitoring
Unluckily, most ITOM professionals only have one pair of eyes. Watching the output of three different solutions requires more than that—you can’t see everything, let alone process all those metrics in a split second. You can’t give up on any of those views either, as each tool monitors and diagnoses complementary aspects of IT service delivery. Many ITOM teams mention they’re struggling to get a clear, high-level view of the overall performance and availability of the digital business services they deliver to users.
Real-Time View vs. Aggregated View
We’re coming to our two questions at the top of this article. You don’t have to pick between views, both matters.
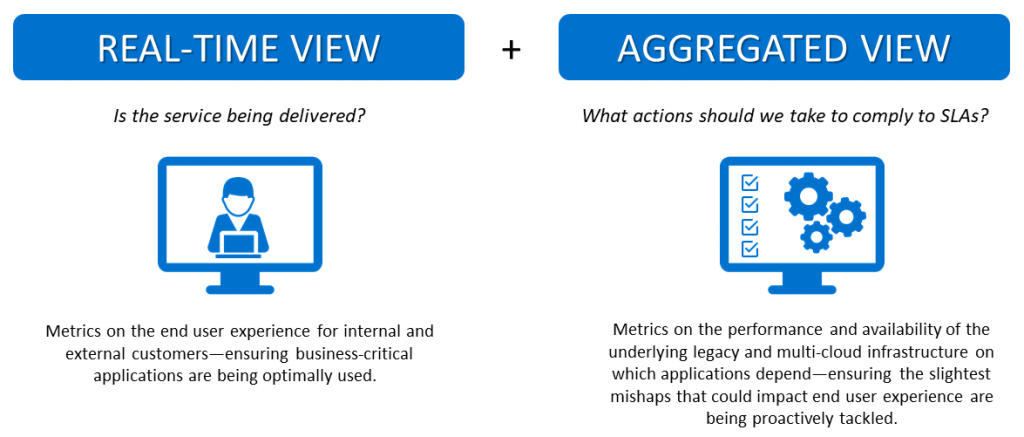
“Through integration, you get to see if business-critical applications are being optimally used and if there are any degradation risks developing at the underlying infrastructure level, be it multi-cloud or traditional data centers.”
Key Points to Prepare an Internal Conversation on ITOM Integration
If you’ve been advocating for streamlined ITOM and want to communicate in just a few points what the Centreon EMS and SkyLIGHTTM PVX integration means for your organization—these will help you prepare for the conversation. We can also walk your team through it—call us to book a personalized demo.
- What is Centreon EMS? An umbrella ITIM solution that provides multiple real-time views and analytical reports to see key availability and performance indicators—from infrastructure all the way up to business applications—and to share insights across IT operations to better align with business objectives.
- What is Accedian SkyLIGHT PVX ? A solution that combines NPMD and APM into one single integrated solution to keep track of every network flow and application transaction at scale, computing ready-o-analyze end user experience metrics.
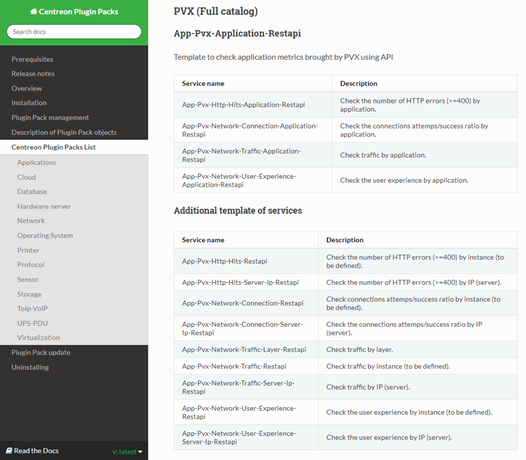
- How Are Solutions Integrated? Centreon EMS builds on over 300 Plugin Packs to either directly collect key IT infrastructure metrics or indirectly connect to adjacent monitoring tools and collect advanced NPMD or APM indicators. Centreon developed a Plugin Pack to poll SkyLIGHT PVX and retrieve key metrics that can then be integrated into the suite of Centreon EMS viewing and reporting tools.
- How Does It Work? Centreon EMS leverages SkyLIGHT PVX API and PVQL query language to collect the exact application performance metrics ITOM organization need in their reconciled views to detect, diagnose and fix performance problems faster.
- What Can We Do With This? Using Centreon EMS and the SkyLIGHT PVX Plugin Pack, ITOM teams can:
- Implement business application service mapping that correlates end user experience and infrastructure metrics into a single aggregated indicator.
- View & share real-time graphical dashboards that display end user experience information alongside infrastructure performance and availability diagrams.
- Report on their applications SLA, MTBF, MTTR with consolidated end user experience and Infrastructure metrics to better understand the business impact of technical decisions.
with its own Hybrid IT Infrastructure monitoring metrics.
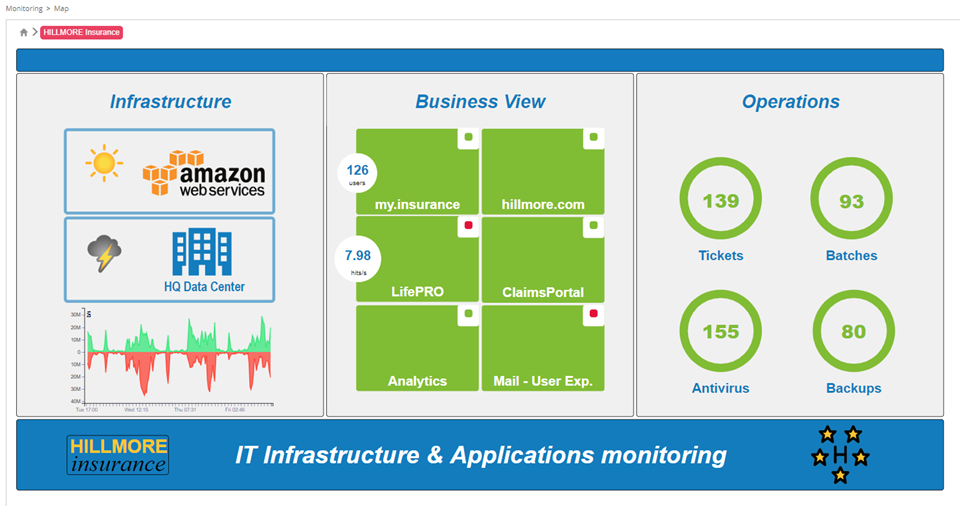
(LifePRO application: hits per sec., my.insurance portal: connected users)
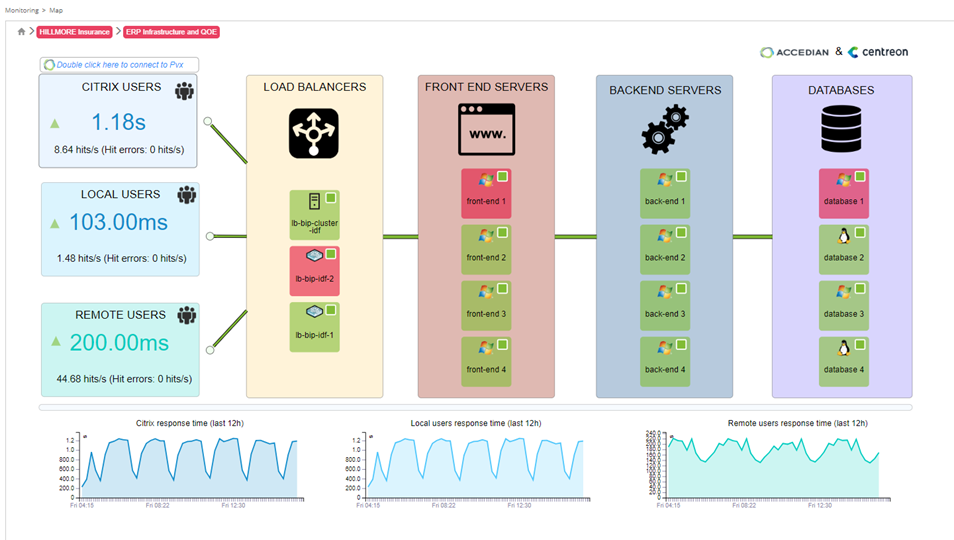
with infrastructure availability indicators.
See documentation.centreon.com
Share


