


Azure Monitoring
Back to glossaryUnderstanding Azure Monitoring
Monitoring is at the heart of successful cloud adoption and management. With Microsoft Azure powering critical applications and infrastructure worldwide, organizations require in-depth visibility into every layer of their cloud ecosystem. Azure Monitoring provides the tools and capabilities to measure, analyze, and act on performance, security, and availability data in real time. From pinpointing bottlenecks to preempting security threats and managing cloud costs, Azure Monitoring empowers IT teams and decision-makers to maintain control in complex and dynamic environments. This guide explores the comprehensive landscape of Azure Monitoring, including tools, key performance indicators (KPIs), challenges, and strategies to maximize the value of your Azure investment.
What is Azure Monitoring?
Azure Monitoring refers to the continuous tracking, analysis, and management of the performance, availability, and security of applications, services, and resources within the Microsoft Azure cloud platform. In a modern IT environment where businesses rely heavily on Azure, efficient monitoring ensures seamless operation, security, and optimal performance across various Azure environments.
What tools are involved in Azure Monitoring?
Key Azure monitoring tools include Azure Monitor, Azure Log Analytics, Application Insights, Azure Security Center, and Azure Automation. These tools collectively provide comprehensive visibility into Azure resources, leveraging critical KPIs such as response time, error rates, CPU usage, memory utilization, network throughput, availability status, and security events.
Third-Party Monitoring Tools
Third-party solutions, such as Centreon, provide extended observability for hybrid and multi-cloud environments. They offer customizable dashboards, anomaly detection, SLA tracking, and integrations with Azure Monitor for centralized data collection and management.
Learn more about how Centreon monitors Azure.
Which IT profiles may benefit from Azure Monitoring?
Various stakeholders benefit from Azure monitoring, including IT operations teams, security professionals, DevOps engineers, business analysts, and executives. Effective monitoring ensures that IT teams can proactively address issues before they impact end-users, reduces downtime, and improves overall resource utilization and security posture. It also provides business analysts and executives with essential insights to inform strategic decisions and optimize costs.
The risks of missing out on Azure Monitoring
Neglecting Azure monitoring presents significant risks, such as undetected performance bottlenecks, security vulnerabilities, excessive downtime, suboptimal resource allocation, and escalating operational costs. Without robust monitoring, organizations may experience compromised application performance, reduced productivity, increased vulnerability to cyber threats, and financial losses due to inefficient resource management.
Benefits of Azure Monitoring
Proactive Issue Resolution
Azure Monitoring identifies potential performance issues early, enabling immediate resolution through Azure monitor alerts and automated remediation. This approach ensures critical applications and Azure resources remain performant and reliable.
Enhanced Security
Continuous monitoring via Azure Security Center enables the identification and rapid addressing of security vulnerabilities, ensuring that Azure subscriptions remain secure against evolving threats.
Cost Optimization
Azure monitoring enables efficient resource allocation through Azure Monitor metrics, Azure Cost Management tools, and insights from Application Insights cost management. By tracking resource usage patterns, organizations can optimize Azure spending effectively.
Improved Scalability and Performance
Azure monitoring adapts seamlessly as infrastructure scales. Insights from Azure application monitoring tools and Azure Monitor maps guide resource scaling decisions, ensuring performance consistency even as load increases.
| Benefit | Description | Key Tools & Features |
| Proactive Issue Resolution | Early detection and automated remediation of issues | Azure Monitor Alerts, Automation Runbooks |
| Enhanced Security | Quick identification and mitigation of security threats | Azure Security Center |
| Cost Optimization | Efficient resource tracking and cost-effective resource allocation | Azure Cost Management, Application Insights |
| Improved Scalability & Performance | Real-time insights guiding resource scaling and performance optimization | Azure Monitor Metrics, Azure Monitor Maps |
Challenges in Azure Monitoring
As powerful and flexible as Azure Monitoring can be, implementing an effective monitoring strategy is not without its difficulties. Organizations must navigate a wide range of technical and operational complexities to ensure complete visibility across Azure environments. From managing vast amounts of telemetry data to controlling associated costs and integrating tools across hybrid infrastructures, these challenges can hinder the effectiveness of even the most advanced cloud teams. Understanding these hurdles is essential for designing resilient and scalable monitoring frameworks that deliver actionable insights without unnecessary overhead.
Complexity of Azure Environments
Azure environments encompass a wide range of services, such as virtual machines, databases, and Kubernetes clusters, each requiring specialized monitoring solutions. This complexity requires the careful integration and management of multiple Azure monitoring services, including Azure Monitor, Application Insights, and custom solutions, to maintain comprehensive visibility and effective oversight.
Data Management
Azure monitoring generates vast amounts of monitoring data from logs, metrics, and events. Efficient data management is crucial, requiring advanced solutions such as time series databases, big data analytics platforms, and machine learning tools to effectively sift through and analyze this data. Proper data management enables teams to derive actionable insights, identify trends over time, and promptly address operational issues.
Cost Management
Balancing comprehensive monitoring coverage with cost-effectiveness is a challenging task. Monitoring services, such as Azure Log Analytics and Application Insights, incur expenses based on the volume and retention of data. Strategic use of Azure Cost Management and Azure Monitor workspace optimization is crucial for efficiently managing these costs.
| Challenge | Description | Recommended Solutions |
| Complexity of Environments | Multiple Azure services require integrated, specialized monitoring | Azure Monitor, Third-party solutions like Centreon, Custom Solutions, Integration Tools |
| Data Management | High data volumes require advanced analytics for actionable insights | Time Series Databases, Machine Learning Analytics |
| Cost Management | Monitoring services can lead to escalating operational costs if unmanaged | Azure Cost Management, Workspace Optimization |
Key KPIs of Azure Monitoring and Their Stakeholders
To ensure effective Azure monitoring, organizations rely on a variety of key performance indicators (KPIs) that track the health, performance, and security of their cloud environment. These KPIs inform actionable decisions and guide stakeholders in maintaining and optimizing operations.
Core KPIs in Azure Monitoring
- CPU Usage & Memory Utilization: Indicates the performance health of virtual machines and services.
- Disk I/O & Network Throughput: Tracks data transfer rates and input/output performance.
- Availability Rate/Uptime: Measures system and application availability, essential for SLAs.
- Response Time: Reflects how quickly services respond to user or system requests.
- Error Rate: Detects system or application failures and reliability issues.
- Apdex Score: Quantifies user satisfaction based on latency thresholds.
- Security Events: Highlights unauthorized access, threats, or policy violations.
- Resource Cost Consumption: Monitors usage versus budget for cost control.
Stakeholders and Their Interests in Azure Monitoring KPIs
| KPI Category | Example KPIs | Primary Stakeholders | Purpose/Usage |
| Infrastructure Health | CPU, Memory, Disk I/O, Network | IT Operations, System Admins | Monitor resource limits, prevent outages, scale infrastructure |
| Application Performance | Response Time, Apdex, Error Rate | DevOps, Application Owners, QA Teams | Improve user experience, troubleshoot code, optimize load balancing |
| Security & Compliance | Security Alerts, Policy Violations | Security Teams, Compliance Officers, Risk Managers | Detect breaches, ensure compliance, harden security posture |
| Availability | Uptime, SLA Metrics, Downtime | IT Management, Executives, Service Reliability Engineers | Maintain SLAs, report on uptime, enhance reliability |
| Cost Optimization | Cost Consumption, Resource Sprawl | Finance, Cloud Architects, IT Directors | Optimize spend, eliminate unused resources, align with business goals |
Understanding and actively tracking these KPIs ensures not only system performance and reliability but also contributes to cost efficiency, regulatory compliance, and customer satisfaction across all levels of an organization.
Key Components of Azure Monitoring
Azure Monitoring is a multi-layered ecosystem of tools, services, and integrations designed to ensure comprehensive observability across the Azure platform. Each component plays a unique role in collecting, analyzing, and responding to telemetry data from Azure resources.
Azure Monitor
Azure Monitor is the central hub for collecting and analyzing data from Azure services. It provides a unified monitoring experience for metrics, logs, and diagnostic data, enabling real-time visibility and operational insights. Azure Monitor also supports alert rules and action groups to automate response mechanisms and integrates natively with dashboards and workbooks.
Azure Log Analytics
As part of Azure Monitor, Log Analytics provides a robust querying engine to analyze log data across multiple sources. Users can write powerful queries using Kusto Query Language (KQL) to detect anomalies, diagnose issues, and generate reports. It supports integrations with Azure Security Center, Azure Automation, and external SIEM tools.
Azure Application Insights
Application Insights is tailored for application performance monitoring, specifically for web and cloud applications. It provides deep telemetry on response times, dependency failures, user interaction, exception tracking, and performance diagnostics. KPIs such as Apdex scores, request durations, and availability tests help ensure optimal user experiences.
Azure Security Center
Azure Security Center delivers advanced threat protection and compliance management. It continuously scans for vulnerabilities, analyzes risk exposure, and generates security recommendations. It integrates seamlessly with Azure Monitor to produce alerts based on threat detection and policy violations.
Azure Automation
Azure Automation enables IT teams to create runbooks and automate frequent monitoring tasks such as scaling resources, restarting services, or applying patches. It also supports integration with Azure Logic Apps for orchestrating complex workflows and responding dynamically to alerts.
Summary Table: Key Components of Azure Monitoring
| Component | Primary Function | Key KPIs & Use Cases |
| Azure Monitor | Centralized monitoring for metrics and logs | CPU usage, Memory, Network traffic, Custom metrics |
| Azure Log Analytics | Query-based log analysis across services | Troubleshooting, Trend analysis, Security audit logs |
| Azure Application Insights | Application performance monitoring | Response time, Failure rate, Dependency latency, Apdex score |
| Azure Security Center | Threat detection and security posture management | Security alerts, Vulnerability status, Compliance recommendations |
| Azure Automation | Workflow automation and response orchestration | Runbook execution, Auto-remediation, Scaling actions |
| Third-Party Tools | Enhanced analytics and hybrid monitoring | Unified dashboards, SLA monitoring, and Predictive analytics |
Azure Monitoring by Resource Type
Azure environments comprise diverse resource types—each with unique performance characteristics, monitoring needs, and business implications. To maintain a high-performing and secure cloud ecosystem, it’s essential to apply tailored monitoring strategies to specific resources such as databases, networks, APIs, and application services. By leveraging Azure’s native capabilities and purpose-built monitoring tools, organizations can gain deep visibility into each resource type, detect anomalies in real time, and respond swiftly to operational issues. This section examines how Azure monitoring tailors its approach to meet the distinct requirements of various resource categories, delivering comprehensive observability and performance optimization.
Azure SQL Database and Server Monitoring
Azure SQL database monitoring and Azure SQL server monitoring provide essential insights into database health, performance, and usage patterns, ensuring optimal database operation and reliability.
Azure Network Monitoring
Azure network monitoring enables continuous oversight of network resources, allowing for rapid detection of performance issues and security threats, thereby maintaining optimal network performance.
Azure APIM and App Services Monitoring
Monitoring Azure Application Programming Interface Management (APIM) and Azure app services is critical for maintaining application performance, diagnosing issues promptly, and ensuring high availability.
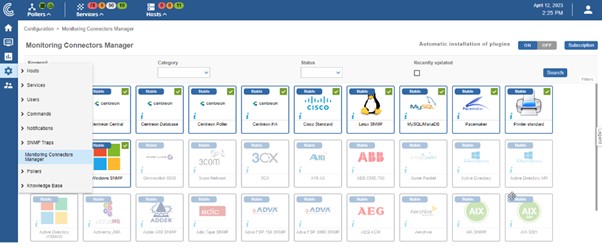
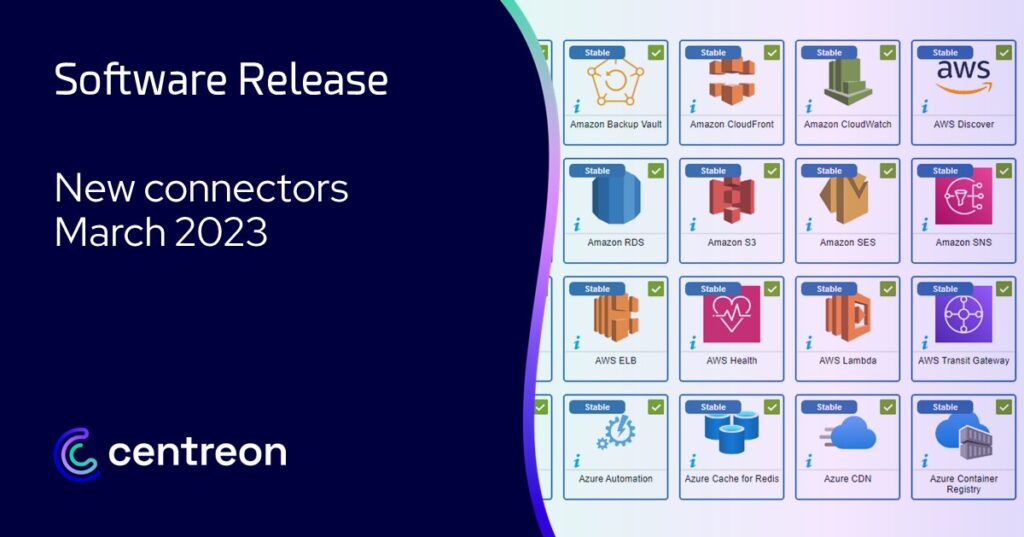
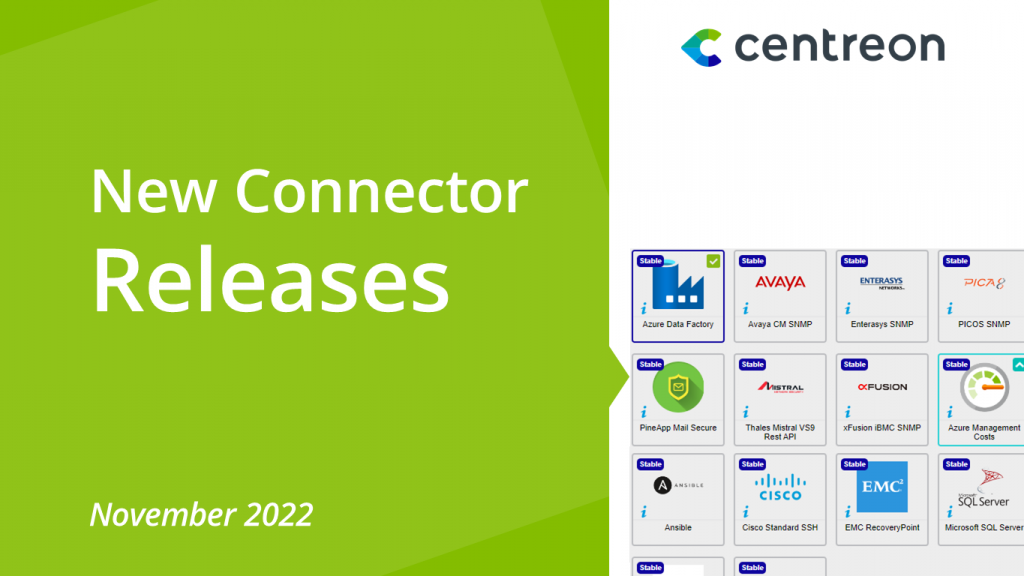
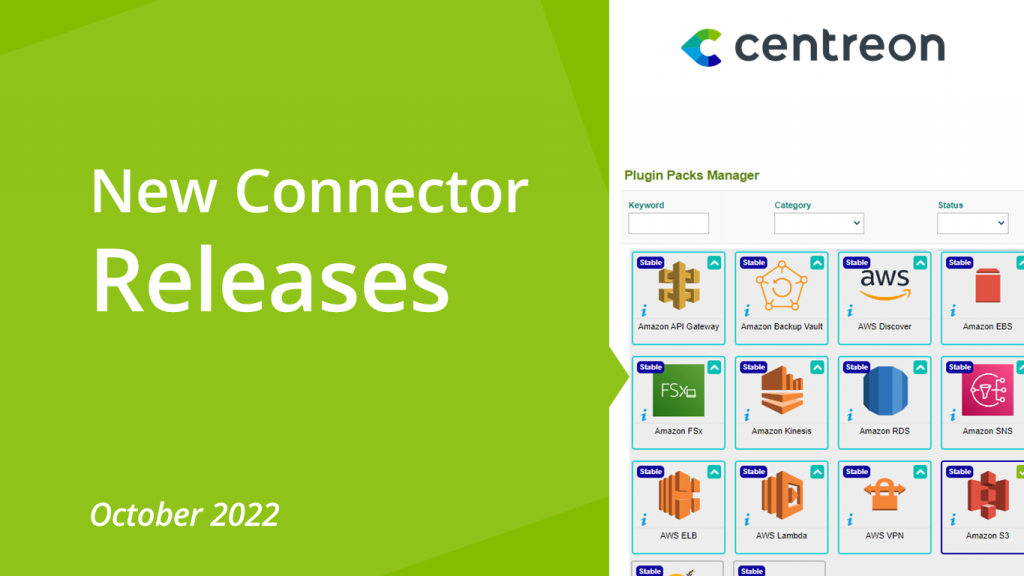
Monitoring Connectors: Powerful plug‑and‑play integration for Azure
Centreon offers a dedicated Azure Monitor connector, simplifying the end-to-end monitoring of Azure environments. It supports auto‑discovery of Azure resources and captures vital telemetry from across VMs, SQL databases, APIM, Kubernetes, and more, all in a standardized fashion. The connector integrates seamlessly with Centreon’s dashboards and alerting, enabling KPIs like CPU usage, memory, disk I/O, network traffic, and even custom log analytics—all available out of the box. For operators and DevOps teams seeking centralized control, these pluginpacks offer built‑in thresholds, macro‑driven customization, and multi‑mode connectivity (API or Azure CLI), empowering them to onboard resources, assign Action Groups, and monitor across roles and responsibilities with minimal overhead.
Tools and Techniques
Effective Azure monitoring relies on more than just data collection—it requires the right tools and techniques to interpret, visualize, and act on that data. Microsoft Azure offers a suite of built-in capabilities that streamline the monitoring process, from agents that gather telemetry to dashboards that provide real-time visibility. These tools not only improve observability across cloud resources but also enhance automation, governance, and responsiveness. In this section, we explore essential Azure monitoring components, including the Azure Monitor agent, interactive dashboards and workbooks, activity logs, and action groups—each playing a vital role in delivering a connected and intelligent monitoring strategy.
Azure Monitor Agent
The Azure Monitor agent streamlines data collection from guest operating systems and Kubernetes clusters, simplifying management and providing enhanced monitoring experience across diverse Azure resources.
Azure Monitor Dashboard and Workbooks
Azure monitoring dashboards and customizable workbooks offer a single-pane-of-glass visualization, providing powerful insights into Azure operations, trends over time, and real-time metrics.
Azure Activity Log and Action Groups
Azure Activity Log tracks all management events, facilitating audit and compliance needs. Action groups automate response activities, enhancing the efficiency of monitoring operations.
The Added Power of Agentless Monitoring
Agentless monitoring is a key advantage when managing dynamic, large-scale Azure environments. For example, Centreon’s agentless approach leverages native Azure APIs to collect performance metrics, availability data, and usage statistics—without requiring software agents to be installed on individual Azure virtual machines or services. This method offers several important benefits:
Simplified Deployment: Agentless monitoring eliminates the need to manage, install, and maintain agents on each monitored resource. This significantly reduces onboarding time, especially in scalable or hybrid cloud environments where new resources are provisioned frequently.
Reduced Overhead and Risk: Without agents consuming CPU, memory, or storage on your Azure VMs, there’s less impact on performance. Moreover, agentless monitoring avoids the potential security vulnerabilities or compatibility issues that can arise from agent-based installations.
Centralized Visibility and Control: Centreon collects Azure monitoring data—such as platform metrics, logs, and alerts—via secure API calls, offering a unified, real-time view of your cloud ecosystem from a single pane of glass. This includes resources like Azure VMs, SQL databases, App Services, and more.
Cost Efficiency: By avoiding agent installation and management, organizations lower operational costs and complexity. Agentless methods also avoid licensing issues and reduce resource usage that might otherwise contribute to Azure consumption costs.
Seamless Scalability: As Azure resources scale dynamically, Centreon’s agentless monitoring automatically adapts to include newly provisioned services through auto-discovery, ensuring comprehensive coverage with minimal manual effort.
Learn more about agentless monitoring.
Azure Monitoring Tutorials and Documentation
For users new to Azure monitoring, Azure monitoring documentation and tutorials offer an easy way to familiarize oneself with key monitoring concepts, setup guides, and best practices to optimize Azure environments effectively.
Azure Monitoring with Centreon
Users new to Azure monitoring, Centreon provides comprehensive walk-throughs, plugins, and connectors to simplify setup and best practices:
1. “Monitoring Microsoft Azure with Centreon” Tutorial
A step‑by‑step guide detailing how to monitor an Azure Virtual Machine using Centreon Plugin Packs. It covers:
- Creating an Azure AD application and service principal for API access.
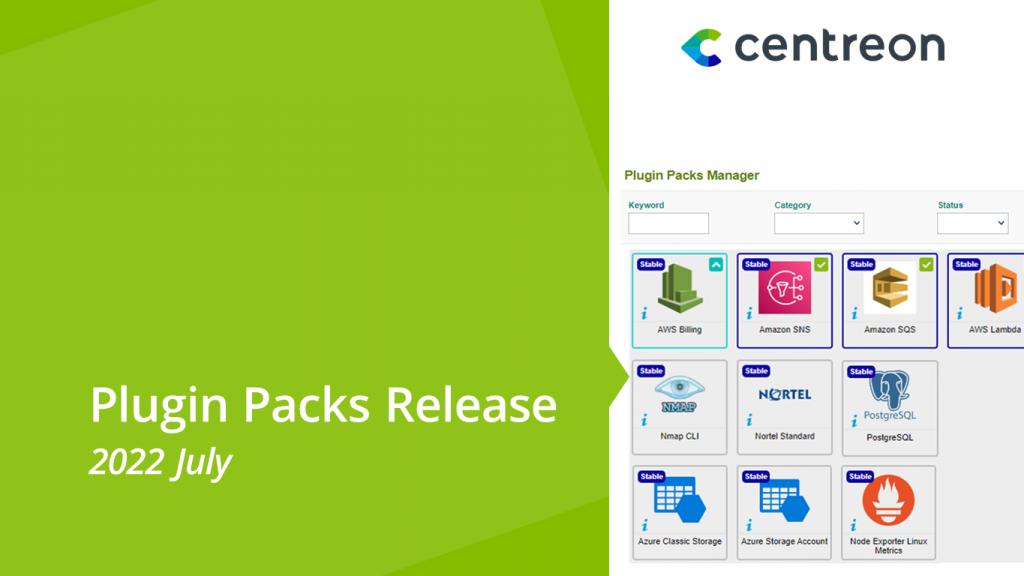
- Installing Plugin Packs via Centreon’s Plugin Pack Manager.
- Deploying the centreon‑plugin‑Cloud‑Azure‑Compute‑VirtualMachine‑Api to monitor VM-specific metrics like CPU, memory, disk I/O, and network usage.
Check the Monitoring Azure tutorial here.
2. Centreon Documentation: Azure Monitoring Prerequisites
Official instructions to configure credentials for Azure Monitor API via Centreon connectors:
- Registering an application in Azure AD to obtain Subscription ID, Tenant ID, Client ID, and Client Secret.
- Assigning the “Monitoring Reader” role for API access.
- Option to use Azure API (preferred) or Azure CLI.
3. Centreon Plugin Packs for Specific Azure Resources
Extensive documentation and connectors are available for various Azure services:
| Azure Resource Type | Centreon Connector Pack & Metrics | Reference |
| Azure Virtual Machine | Cloud-Azure-Compute-VirtualMachine-Api measuring CPU, memory, disk, network. | VM monitoring |
| Azure App Service | Cloud-Azure-Web-AppService tracking connections, threads, response time, health. | App Service monitoring |
| Azure Load Balancer | Cloud-Azure-Network-LoadBalancer tracking availability, SNAT, throughput. | Load Balancer metrics |
| Azure Kubernetes Service | Cloud-Azure-Compute-Aks measuring pod/node state, CPU, memory, traffic. | AKS monitoring |
| Azure Monitor API | Cloud-Azure-Management-Monitor for generic metrics and Log Analytics via Kusto queries. | Broad resource monitoring |
Learn more on connectors and pack and metrics
4. Community Tutorials & Webinars
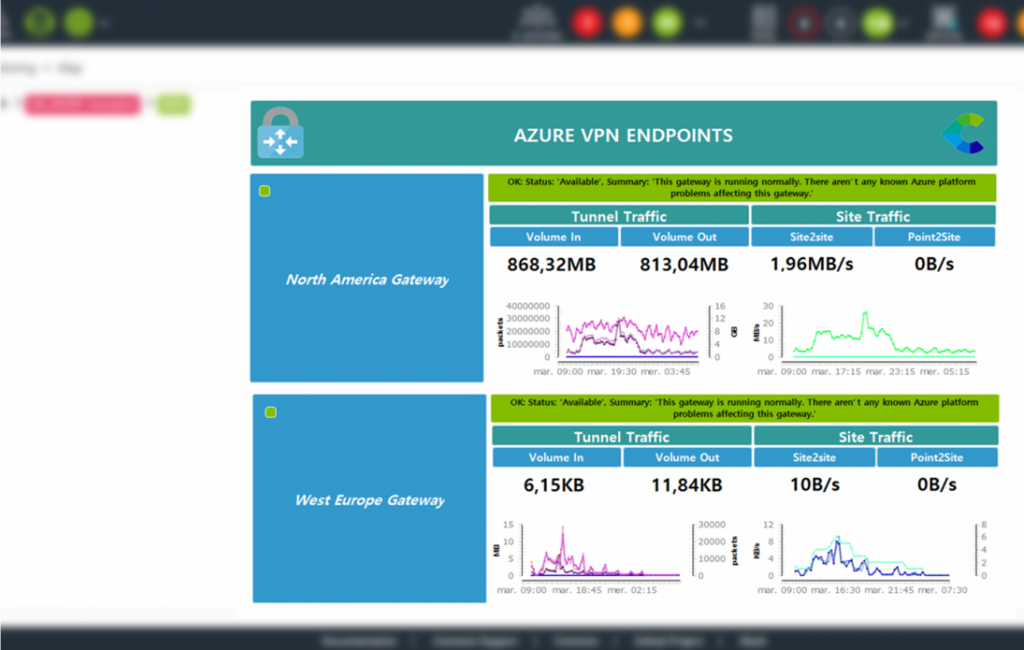
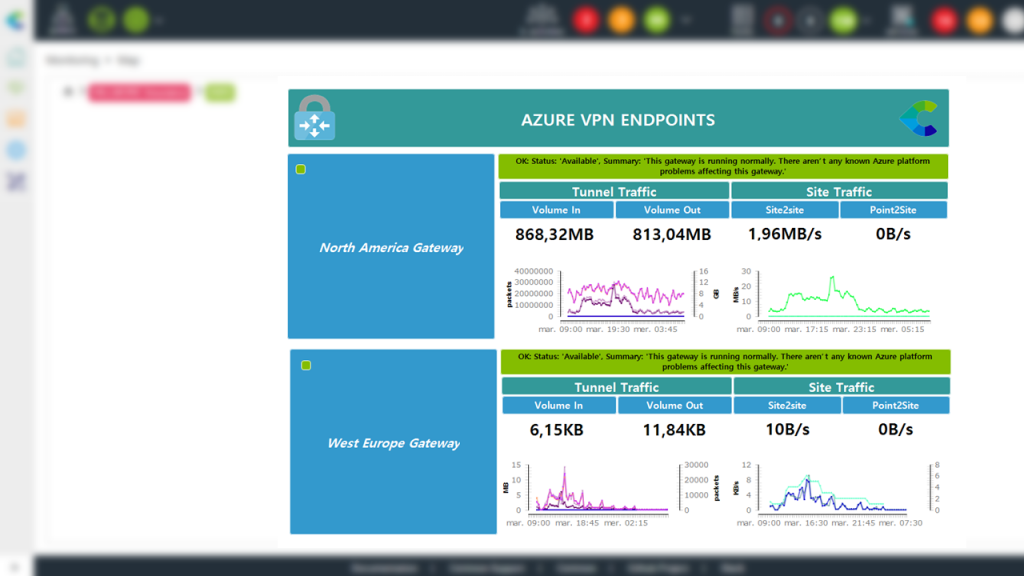
Additional walkthroughs, such as monitoring Azure VPN Gateway, are available via blog posts and webinars:
- Azure VPN Gateway tutorial guides users to monitor encrypted network traffic using dedicated Plugin Packs.
Reporting for Azure Monitoring
Effective monitoring is only one part of the equation; generating actionable reports and visual insights is essential for effective communication, governance, and continuous improvement. Below, you’ll find practical reporting guidance for Azure monitoring via Centreon.
Why Azure Monitoring Reporting Matters
- Governance & Compliance: Distribute reports that show Azure resource utilization, uptime, and security events to meet internal and external audit requirements.
- Performance Insights: Highlight trends over time—CPU, memory, and network usage—to inform capacity planning and performance tuning.
- Business Value: Present technical metrics in executive-friendly dashboards to demonstrate ROI, cost savings, service-level adherence, and alignment with business outcomes.
Reporting Tools and Techniques in Centreon
| Feature | Description | Use Case |
| Dashboards & Workbooks | Centralized “single pane of glass” visual summaries of Azure metrics. Customizable to showcase trends over time, availability, and critical alerts. | Real-time operations review; capacity planning sessions. |
| CLAPI (Command Line API) | Automates the extraction and export of reporting data. Supports scheduled report generation or integration with external BI tools. Learn more on CLAPI here. | Scheduled compliance snapshots or custom analytics pipelines. |
| Plugin Pack Dashboards | Each Azure Connector Pack delivers pre-configured service and host templates. These can be included in Centreon dashboards to show status, performance, and key metrics. | Quick-start dashboards for VMs, SQL, App Service, AKS, etc. |
| Auto-Discovery Reports | Centreon’s auto-discovery feature reports cloud asset changes over time—ideal for maintaining visibility in dynamic Azure environments. | Track resource additions/removals and ensure coverage. |
| Analytical Reports | Integrating Azure Monitor API data (via Plugin Packs) in CSV or XML feeds. Coupled with Centreon’s analytics engine for customizable, exportable reports. | Trend analysis on CPU/memory, network I/O, and SQL DB sizes. |
Sample Reporting Use Cases
- Executive Summary Dashboard
- High-level metrics: All Azure environments, aggregated availability, cost trends, and performance health.
- Highlight cost savings, uptime %, and signal anomalies.
- Operational Report by Resource Type
- Tabular or graphical views for Azure SQL, App Services, VMs, and AKS.
- Include resource counts, active alerts, CPU/memory trending, and top 10 busiest resources.
- Security & Audit Compliance Report
- Show Azure Activity Log summaries, action group triggers, and Security Center events.
- Used in quarterly reviews or audits, generated with CLAPI or REST API.
- Capacity Planning & Trend Analysis
- Leverage historical time-series data (from dashboards/exports) to forecast growth.
- Drive a right-sizing project using reports on underutilized VMs or oversized SQL tiers.
Azure Monitoring Use Cases
Real-world use cases and success stories bring Azure monitoring to life, demonstrating how organizations leverage Centreon to optimize cloud ecosystems. Whether it’s performance, cost control, or multi-cloud observability, these case studies offer valuable lessons and proof of impact.
Core Azure Monitoring Use Cases
| Use Case | Description | Key Outcomes |
| Azure resource monitoring | Automated discovery and policy-based monitoring for VMs, SQL, AKS, etc. | Quick deployment, consistent oversight, proactive alerts |
| Cost optimization | Integration with Azure billing data and tagging | Prevent overspend, inform budgeting, optimize spend |
| Hybrid & multi-cloud | Unified monitoring across cloud and on-prem environments | Single-pane observability, seamless troubleshooting |
| VPN gateway monitoring | Secure overlay monitoring and performance visibility | Enhanced security and networking insights |
| Container readiness | AKS and Prometheus-driven container metrics | Support for container scalability and efficiency |
Real-World Examples of Successful Azure and Cloud Monitoring
ITS Integra
“Thanks to the Centreon IT monitoring platform’s flexibility and scalability, we meet our clients’ latest IT and business requirements. Using just one solution, we manage legacy and cloud environments, automate all our processes, and provide highly visual dashboards to technical and managerial profiles alike.”
Monoprix
“We have a centralized monitoring system allowing us to monitor the company social network, as well as VDIs (virtual desktops) hosted on Google Cloud, Microsoft Azure microservices, and Kubernetes PODs. We also monitor emails sent to customers and to delivery service partners, through Microsoft Azure.”
FM Logistic (Supply Chain) We took a pragmatic approach: Cloud monitoring tools work perfectly within the cloud environment. But we needed to look beyond the cloud to adopt a commercial monitoring platform that could consolidate all alerts, KPIs, and business maps, managing all metrics across domains: cloud, SaaS and on premises, which Centreon allows.”
MSP REST Solution
“We remotely monitor any architecture type (cloud, on premise, network), AWS, Azure or VMware… Centreon covers the full range of diverse, hybrid, and distributed environments. We really like being able to interface the Centreon monitoring solution with Cisco Meraki, using the API.”
Azure Monitoring Success Factors: Takeaway
- Scalable deployment across multiple Azure and cloud services
- Cost governance and insight-driven optimization
- Single-pane observability across hybrid infrastructures
- Specialized monitoring tailored to gateways, containers, SQL, and more
Centreon’s customer success stories demonstrate how Azure and cloud monitoring deliver clear returns, including reduced costs, faster deployment, unified visibility, and expanded digital services. These measurable benefits showcase Centreon’s value as a strategic investment in observability and IT governance.
Azure Monitoring at a Glance
| Aspect | Key Details |
| Fast Facts & Core Value | – Continuous visibility across all Azure resources (VMs, networking, containers, APIs)
– Unified stack using Azure Monitor, Application Insights, Security Center, and Centreon plugins |
| Primary KPIs Monitored | – Infrastructure: CPU, memory, disk I/O, network throughput
– Applications: response time, error rate, Apdex – Security & Audit: activity logs, threat alerts – Database: SQL DTU, connection latency |
| Essential Tools & Techniques | – Azure Monitor Agent for telemetry from VMs and AKS
– Dashboards & Workbooks for single-pane visualizations – Activity Logs & Action Groups for governance and automation – Centreon Plugin Packs for VM, SQL, AKS, VPN Gateway, etc. |
| Key Challenges & Strategies | – Complex environments require layering native Azure tools with Centreon connectors
– High data volume: manage with time-series DBs and ML analytics – Cost management: optimize workspace usage and use automated reporting |
| Common Use Cases | – Rapid Azure onboarding with auto-discovery and templates
– Unified multi-cloud visibility (Azure, AWS, Kubernetes) – Secure VPN and container health monitoring – Tag-based billing and cost optimization |
| Reporting & ROI | – Executive dashboards and exportable reports (PDF, Excel)
– Operational performance summaries by service – Audit-ready activity logs and trend reporting – Reported 25% YoY growth and TCO savings using Centreon Cloud |
Frequently Asked Questions about Azure Monitoring
What is Azure Monitor?
Azure Monitor is Microsoft’s integrated monitoring service designed to track the performance, availability, and security of Azure resources and applications, providing insights through detailed analytics and alerts.
What are the main functions of Azure Monitor?
Azure Monitor’s primary functions include data collection and analysis, real-time alerting, log analytics, application performance monitoring, dashboard visualization, and automated response management.
What are Azure Monitoring tools?
Azure Monitoring tools encompass native Azure services like Azure Monitor, Application Insights, Log Analytics, Security Center, and Azure Automation, as well as integrated third-party solutions like Datadog and Dynatrace.
What is the difference between Azure Monitor and Log Analytics?
Azure Monitor is the overarching platform for collecting, analyzing, and acting on telemetry data from your Azure resources, applications, and infrastructure. It provides a centralized hub for observability across your entire Azure environment, including tools for metrics, logs, alerts, dashboards, and more.
Log Analytics, on the other hand, is a key feature within Azure Monitor focused specifically on querying and analyzing log data. It utilizes a powerful query language (KQL – Kusto Query Language) to search through logs collected from various sources, including virtual machines, Azure resources, and applications.
Key Differences:
| Feature | Azure Monitor | Log Analytics |
| Scope | End-to-end monitoring platform | Component for querying and analyzing logs |
| Data Types | Metrics, logs, traces, events | Log data only (from Azure resources and agents) |
| User Interface | Dashboards, metrics explorer, alerts | Log query editor within Azure Monitor |
| Use Cases | Performance monitoring, alerting, visualization | Troubleshooting, diagnostics, trend analysis |
| Integration | Integrates metrics, logs, Application Insights, and alerts | Powers insights and alerts via log queries |
In summary: Azure Monitor is the platform, and Log Analytics is a tool within it for querying and making sense of log data.
What is Azure Monitoring Agent?
Azure Monitoring Agent is software deployed to Azure resources and guest operating systems that collects monitoring data, simplifies management, and provides unified telemetry across diverse resources, enhancing the overall monitoring experience.
What are alert rules in Azure Monitoring?
Alert rules in Azure Monitoring are automated configurations that track specific conditions across your Azure environment and trigger actions when those conditions are met. These rules monitor metrics (such as CPU usage or response time), logs (including failed logins or error messages), or activity logs (like resource changes). Each rule includes criteria (the threshold or condition), the scope (the resources being monitored), and an associated action group (such as email alerts, webhook calls, Azure Functions, or Logic Apps). Alert rules enable real-time visibility and quick incident response, helping IT teams minimize downtime and performance issues.
What are key Azure Functions?
Azure Functions are a serverless compute service that enables developers to run event-driven code without managing infrastructure. These functions are lightweight and scalable, triggered by events such as HTTP requests, timer schedules, or messages from other Azure services (like Event Hubs or Service Bus). In the context of monitoring, Azure Functions are often used in action groups to automatically respond to alerts—like restarting a VM or logging an event—making them an essential part of an automated remediation strategy in Azure Monitoring.
What are key platform metrics in Azure Monitoring?
Platform metrics are built-in performance and health indicators automatically collected by Azure from resources like virtual machines, databases, storage accounts, and networking components. Common platform metrics include:
- CPU utilization
- Memory usage
- Disk IOPS and latency
- Network in/out throughput
- Request counts and failure rates
- Availability and uptime status
These metrics provide essential operational insights and are accessible through Azure Monitor Metrics Explorer, dashboards, and alert rules, helping to detect issues, optimize performance, and support capacity planning.
Are there custom solutions to monitor Azure?
Yes, Azure supports custom monitoring solutions through the use of Log Analytics queries, custom metrics, and third-party integrations. Organizations can define their own telemetry collection using the Azure Monitor Agent, track application-specific metrics with Application Insights SDKs, or create complex monitoring flows using Azure Logic Apps and Event Hubs. Additionally, solutions like Centreon offer plugin-based integration with Azure Monitor, enabling custom templates and discovery modes to tailor monitoring to business-critical Azure resources, including hybrid and multi-cloud environments.
What are Azure Logic Apps?
Azure Logic Apps are a low-code/no-code service that allows you to build automated workflows connecting Azure services and external applications. In Azure Monitoring, Logic Apps are often used to automate responses to alerts—for example, logging incidents, notifying teams on Microsoft Teams or Slack, or triggering corrective actions like restarting a service. Their drag-and-drop designer and large connector library make it easy to integrate monitoring events with broader operational processes, improving efficiency and reducing manual intervention.
What is an Event Hub?
Azure Event Hub is a real-time data streaming platform used to ingest large volumes of telemetry data from multiple sources. In monitoring scenarios, Event Hubs serve as a backbone for collecting and processing logs, metrics, and custom application events. Data sent to an Event Hub can be routed to storage, analytics services such as Azure Stream Analytics or Power BI, or custom consumers for further investigation. Event Hubs are highly scalable and support scenarios like centralized log collection, anomaly detection, and streaming alert pipelines.
What is the Azure Portal?
The Azure Portal is a web-based, unified management interface provided by Microsoft that allows users to build, manage, and monitor all Azure services in one place. The Azure Portal provides a graphical user interface (GUI) where administrators, developers, and IT professionals can:
- Provision and configure Azure resources like virtual machines, databases, storage, and networking.
- Access monitoring tools such as Azure Monitor, Application Insights, and Log Analytics.
- Create and manage dashboards for real-time visibility into system health and performance.
- Define alert rules, view activity logs, and set diagnostic settings.
- Manage user access and security policies via Azure Active Directory integration.
- Automate tasks using Azure Logic Apps, Azure Functions, and templates.
What is SCOM MI and how does it relate to Azure Monitoring?
SCOM MI, or System Center Operations Manager Managed Instance, is Microsoft’s cloud-based version of the traditional SCOM (System Center Operations Manager), designed to provide enterprise-grade infrastructure monitoring as a fully managed Azure service. SCOM MI enables organizations to continue using familiar on-premises SCOM capabilities while extending monitoring to Azure workloads in a hybrid or cloud-native environment.
Within the context of Azure Monitoring, SCOM MI integrates with Azure Monitor and Log Analytics to unify telemetry from both legacy infrastructure and cloud resources. It supports centralized dashboards, alerting, performance counters, and synthetic transactions across virtual machines, databases, applications, and network components—whether hosted on-premises or in Azure.
SCOM MI allows large enterprises with deep investments in traditional SCOM to modernize their monitoring stack gradually, while leveraging Azure-native observability features. It is especially useful for regulated industries or complex IT environments where continuity, compliance, and customization are critical.
Key benefits include:
- Full support for existing SCOM management packs and monitoring configurations.
- Native integration with Azure Monitor metrics and logs for correlated visibility.
- Cloud scalability with managed infrastructure and reduced maintenance overhead.
In summary, SCOM MI bridges traditional IT operations and modern Azure observability, making it a strategic component for organizations adopting hybrid cloud strategies.
What are Azure Logic Apps and how are they used in Azure Monitoring?
Azure Logic Apps are a key component of Microsoft’s integration services platform, designed to help users automate workflows and orchestrate business processes without writing extensive code. With a visual designer and hundreds of built-in connectors (including Microsoft Teams, Outlook, ServiceNow, and third-party APIs), Azure Logic Apps enable IT teams to build event-driven workflows that respond to triggers across services, both inside and outside the Azure ecosystem.
In the context of Azure Monitoring, Azure Logic Apps play a critical role in alert automation and incident response. They are frequently used within Action Groups—a feature of Azure Monitor—to define what happens when an alert condition is met. For example, when an alert is triggered due to high CPU usage or application failure, an Azure Logic App can:
- Send an automated message to an IT support channel (e.g., Microsoft Teams or Slack).
- Create a ticket in an ITSM platform like ServiceNow.
- Log the incident details to a central repository or database.
- Trigger a remediation workflow, such as restarting a virtual machine or scaling out an application service.
Azure Logic Apps offer several benefits in Azure Monitoring scenarios:
- Low-code automation: Easily automate monitoring responses without needing to build complex code or scripts.
- Scalability: Handle large volumes of alerts and incidents across global infrastructures.
- Integration flexibility: Connect monitoring events with broader operational, support, or DevOps processes.
Ultimately, Azure Logic Apps extend the capabilities of Azure Monitoring by enabling intelligent, automated workflows that streamline incident management, reduce response times, and improve service reliability.
How is the Azure Portal used in Azure Monitoring?
The Azure Portal is the central web interface for managing Azure services, including monitoring tasks. Users can configure alerts, view metrics and logs, set up dashboards, manage diagnostic settings, and initiate Logic Apps—all from a unified GUI. It’s an essential hub for daily monitoring operations and visualization.
How are screenshots used in Azure Monitoring?
While screenshots are not a native Azure Monitoring data type, they play an important role in the documentation, analysis, and communication of monitoring insights. In Azure Monitor and related tools such as Workbooks or Dashboards, users frequently take screenshots of visual telemetry—such as performance graphs, metric charts, or live dashboards—to share findings with other teams, report incidents, or support troubleshooting workflows.
Screenshots in Azure Monitoring are especially useful in the following scenarios:
- Incident Reporting: When an alert is triggered, support teams may capture a screenshot of the affected resource’s metrics timeline or log query results to include in a ticket or root cause analysis document.
- Operational Handover: Teams often use annotated screenshots in shift-change emails or runbooks to highlight ongoing issues or recent anomalies.
- Executive Communication: Screenshots of dashboards summarizing uptime, SLA compliance, or cost trends are included in reports or presentations to business stakeholders.
- Knowledge Sharing and Training: Screenshots help illustrate how to navigate Azure Monitor, configure alerts, or interpret Application Insights outputs in training materials and tutorials.
In short, although screenshots are not generated automatically by Azure tools, they complement Azure Monitoring workflows by enhancing visibility, facilitating collaboration, and supporting governance processes across technical and non-technical audiences.
What is tracing in Azure Monitoring?
Tracing refers to the detailed logging of an application’s execution path. In Azure Monitoring, tools like Application Insights collect trace logs that capture request flows, dependencies, and exceptions. Tracing helps developers and DevOps teams identify bottlenecks, debug issues, and optimize code performance.
Are numerical values important in Azure Monitoring?
Absolutely. Azure Monitoring relies heavily on numerical values such as CPU percentages, memory usage (in GB), request durations (in milliseconds), and error rates (as percentages). These values feed dashboards, alerts, and analytics that drive operational decisions and performance tuning.
Pages linked on this


Ready to see how Centreon can transform your business?
Keep informed on our latest news