


Digital Experience Monitoring with Centreon
Optimize user experience
Business performance is closely linked to customer satisfaction and employee productivity, which is why monitoring user experience and, more generally, digital experience monitoring are crucial issues.
USER CONTEXT & CHALLENGES
Why User Experience Has Become a Critical Metric to Monitor
In today’s demanding digital landscape, evaluating the performance of digital services goes beyond server availability or network uptime. What really matters is the actual experience of end users: page load speed, navigation fluidity, and responsiveness of web and mobile applications.
A slowdown or error on a key user journey — such as login, product search, or checkout — can have immediate consequences: decreased conversion rates, session abandonment, reputational damage, or even revenue loss.
That’s why User Experience Monitoring is now a vital complement to traditional IT monitoring. It enables teams to answer critical questions:
- Is my website performing well across all geographies?
- Is the user experience smooth on both desktop and mobile?
- Are slowdowns coming from the frontend, backend, or a third-party provider?
To meet these expectations, Centreon is expanding its observability mission with the acquisition of Quanta, a recognized expert in Synthetic Monitoring (STM) and Real User Monitoring (RUM). This strategic acquisition lays the foundation for the upcoming Centreon Digital Experience Monitoring offering, currently being integrated into the platform.
WHAT WE DO
Centreon Puts User Experience at the Heart of IT Monitoring
Centreon provides an open and modular monitoring solution that bridges the gap between IT performance and digital user experience. Our approach enables you to:
- Monitor key user-perceived quality indicators such as load time, error rate, Apdex, and Core Web Vitals (TTFB, LCP, FID, etc.)
- Simulate critical user journeys on your websites and applications (cart addition, checkout, product search, login, etc.)
- Correlate experience metrics with real infrastructure health (servers, databases, networks, cloud services, CDN…)
- Preserve interoperability with your current APM or DEM tools like Dynatrace, Pingdom, Accedian, Sahi Pro, and others
With the progressive integration of Quanta technology, Centreon expands its native capabilities to include web performance monitoring — while continuing to aggregate metrics from your existing tools.
HOW WE DO IT
A Complete Approach: RUM, STM, and Infrastructure Correlation
Centreon collects, unifies, and contextualizes user experience data inside a single, comprehensive platform.
Synthetic Monitoring (STM) with Quanta
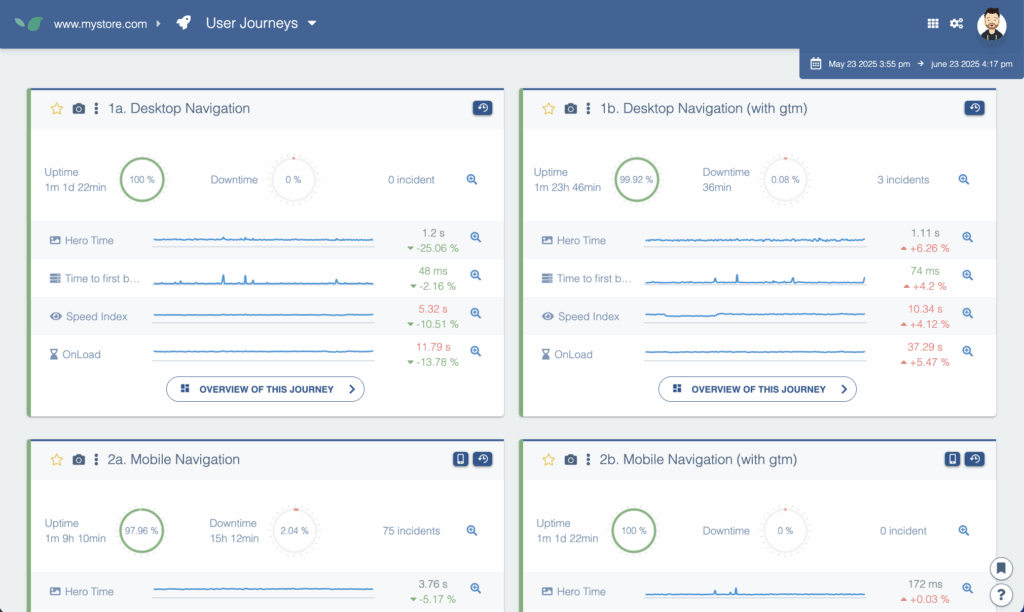
Automated test scenarios are executed at regular intervals from multiple geographical locations and browsers, allowing you to:
- Detect performance degradation before it affects users
- Compare response times across regions, browsers, or devices
- Verify availability and fluidity of business-critical user journeys
Native Real User Monitoring (RUM) with Quanta
Centreon gathers real session data from visitors, including:
- Geolocation, device type, connection speed
- User-perceived experience for each page (TTFB, LCP, First Input Delay, etc.)
- Performance statistics by user segment
IT Infrastructure Integration
All RUM/STM data is:
- Correlated with infrastructure performance metrics
- Visualized in unified dashboards
- Used for anomaly detection, smart alerting, and SLA reporting
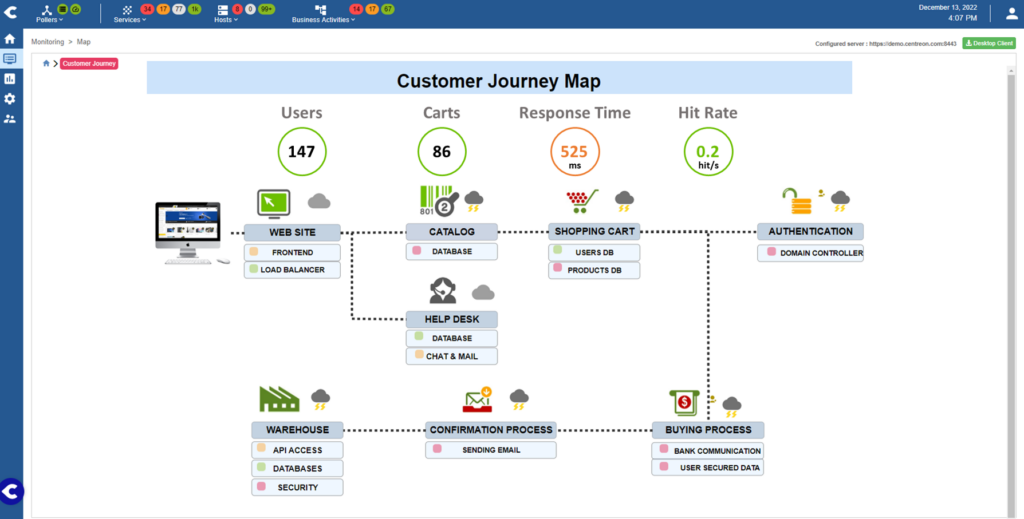
Centreon also continues to ingest indicators from third-party DEM and APM platforms via API.Thanks to Centreon’s business process modeling, user experience performance data collected by the DEM extension can be embedded into end-to-end service views, in both real-time dashboards and periodic SLA reports.
3 KEY BENEFITS
More Reliable, Higher-Performing Digital Services — Driven by Centreon

True End-to-End User-Centric Monitoring
By combining real and synthetic monitoring, Centreon delivers a complete view of digital experience quality — across all channels and user segments.
Faster Incident Resolution
With automated correlation between user perception and technical status, you can identify root causes faster and reduce Mean Time to Resolution (MTTR).
An Open, Unified, and Future-Proof Platform
Enjoy the best of both worlds: new native DEM capabilities via Quanta and continued support for existing monitoring tools. And soon, a fully integrated Centreon Digital Experience Monitoring solution within your familiar interface.


Ready to see how Centreon can transform your business?
Keep informed on our latest news