Laurent Pinsivy, Centreon Product Manager, and Amanda Bankes, MarCom Manager, worked on a step by step tutorial: Using Centreon Host Discovery to monitor a VMware infrastructure.
Cannot read the video? Here is the transcript:
Welcome to this tutorial about the Centreon Host Discovery functionality!
In this video, you will learn how to quickly and easily monitor a complete VMware infrastructure using the Centreon Plugin Packs and their Host Discovery rules. We will demonstrate how Centreon can connect to a vCenter and then automatically discover and monitor the ESX servers and all their virtual machines.
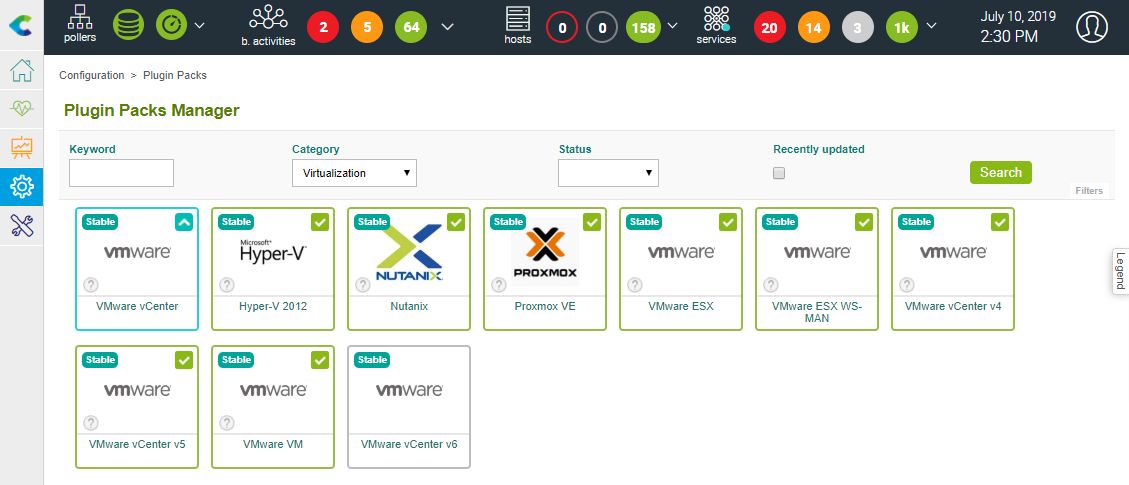
Let’s start by installing the three required Plugin Packs. To do so, go to “Configuration > Plugin Packs” in the menu. In the category filter select the “Virtualization” category and click on the “Search” button.
Now click on the “+”to install the plugin pack:
- The “VMware vCenter v6” Plugin Pack will appear. The manager here explains the Plugin Pack dependencies that will be installed with the Plugin Pack. Click on the “Apply” button.
We also have listed:
- The “VMware ESX” Plugin Pack
- And the “VMware VM” Plugin Pack.
As usual, for each Plugin Pack, you first need to read the Prerequisites chapter of its Monitoring Procedure and carefully follow all the installation and configuration instructions. Click on the “?” icon of each of the three Plugin Packs to access their Monitoring Procedure, and follow the instructions of the prerequisites chapter. For VMware you need to install the Centreon Plugins, the Centreon VMware daemon … and configure it. But don’t forget to start the daemon.
When this is done, we can configure the monitoring of the vCenter platform. Let’s go to the “Configuration > Hosts > Hosts” in the menu and click the “Add” button. Then enter the following information:
- For the name, we’re going to type in “vcenter”
- For the alias, we’re going to type in “My vCenter”
- And for the IP Address / DNS for example, we’re going to type in “192.168.0.1”
Next to “Templates” click on “+ Add a new entry” button to select the dedicated monitoring template that was installed by the vCenter Plugin Pack. In the list, search “vcenter” and select “Virt-VMware2-vCenter-custom”.
This template will add some custom macros and their default values. You may change these values to reflect your exact infrastructure configuration. This is detailed in the Configuration chapter of the Plugin Pack Monitoring Procedure.
Then click on the “Save” button to store your configuration.
Now is the time to automatically discover the ESX servers! Let’s go to the “Configuration > Hosts > Discovery” in the menu. To create a discovery task, click on the “ADD” button. Now, choose “VMware ESX” and click on “NEXT”. At this point, you need to set the connection parameters to access the VMware API, again according to the instructed detailed in the Monitoring Procedure.
Click on “SAVE & RUN” to start the discovery.
A task has been created and will be executed within a few short seconds. Here we can see the task is now complete, let’s look at the result. As you can see, four ESX servers were discovered and the proper monitoring template has been preselected. You can access details of the host by clicking on the information icon. Here we can see the ESX is part of the “Centreon” datacenter. Select all ESX servers and click on “Save”. The ESX servers have now been added to the configuration!
Our VMware infrastructure is now ready to be monitored. But let’s add some virtual machines before deploying the full configuration.
Click on the “ADD” button to create a task to discover your Virtual Machines. Now, choose “VMware Virtual Machine” and click on “NEXT”. Like earlier in the video, don’t forget to set your VMware connection parameters.
Click on “SAVE & RUN” to fully start your discovery process.
Once it is complete, click on the task go through the results. 274 Virtual Machines has been discovered! And here you can visualize all items or use the search filter. In this example we will select the virtual machines pertaining to the mail application. As for ESX, a predefined template has been preselected. Once your Virtual Machine is selected, click on the “SAVE & MONITOR” button.
We’re done! By using the “SAVE & MONITOR” button, we’re adding these virtual machines to the configuration as well as deploying this configuration to start monitoring experience.
Some hosts have already been checked. Let’s click on the banner to directly access the results of the monitoring. Here you can visualize all statuses.
Let’s verify the associated services by going to “Monitoring > Status Details > Services” in the menu. Here we can see the first services in “Unhandled Problems” status… We can also visualize all the services in “OK” status.
Thank you for following this tutorial and see you soon for a new one. Check our other tutorials on Centreon’s YouTube Channel.
Share