Since several versions, Centreon allows to create your own custom views. Many widgets are available and can be configured with several settings to display needed information. This article explains how to create your first custom view based on widgets available from Centreon installation.
Notice: the Centreon’s custom view documentation is available here.
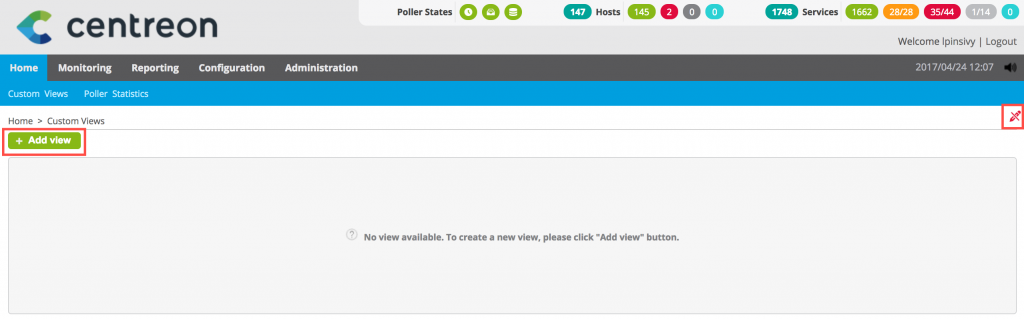
Connect to your Centreon web interface and go to the “home > custom Views” menu. Click on the pen icon on the right to display edition mode. Then click on “Add views” button to create a new view:
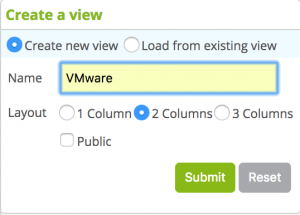
A pop-in appears so that you to define the view name as well as the number of columns:
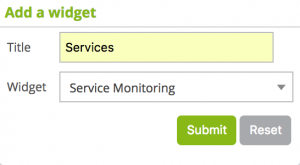
Once the view is created, you can now add widgets. Click on “Add widget” to add your widgets. In this example, we will add “Service Monitoring” widget to display of services linked to ESX servers:
Once the widget is inserted to this view, it displays status of every services monitored. We will configure it to display only services linked to ESX servers. Click on edit button (wrench icon) and set following settings:
![]()
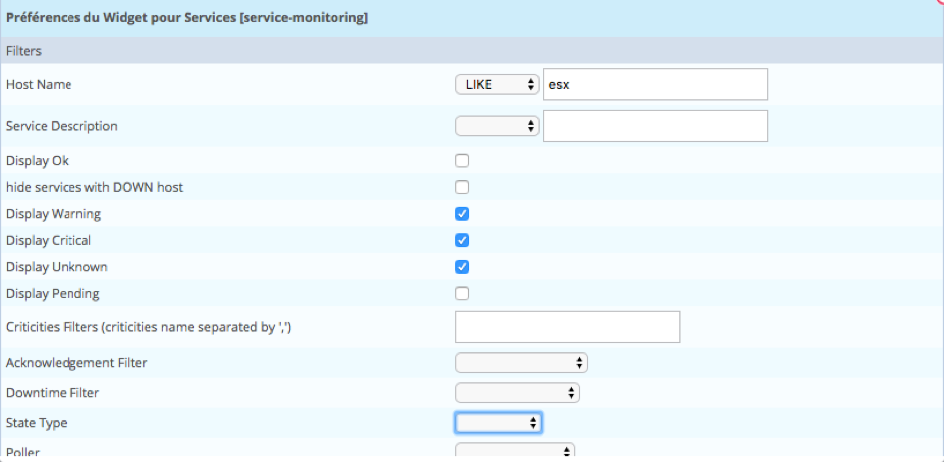
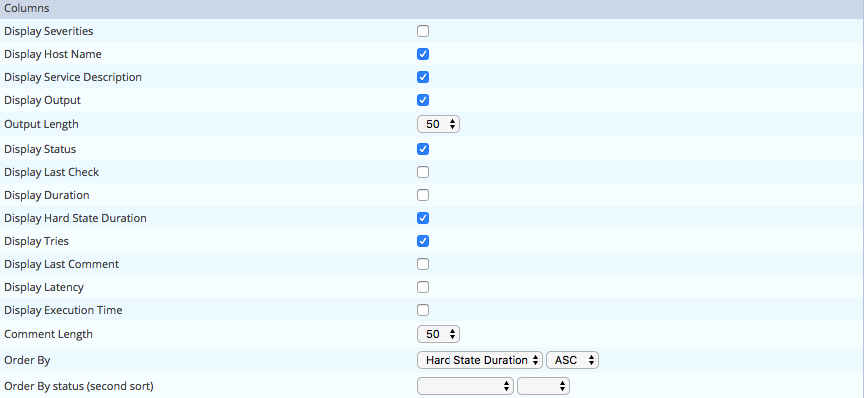

Click on “Apply” button on the bottom of the window. Now only services in “non-OK” status are displayed.
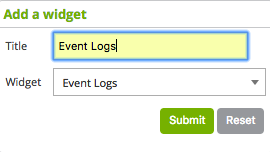
Click on “Add widget” button and select “Event Logs” widget:
Edit the widget settings (wrench icon). In your case, we will select only event logs linked to ESX servers:
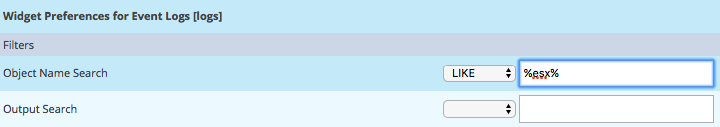
Once parameters defined, click on “Apply” button.
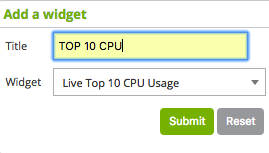
Click on “Add widget” button and select “Live TOP 10 CPU Usage” widget:
Edit the widget settings. In your case we will select only event logs linked to ESX hostgroup:
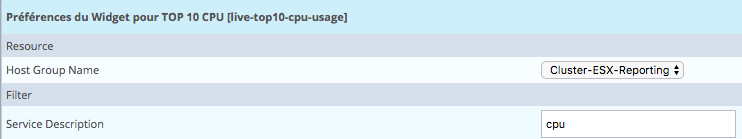
Notice: we use a hostgroup to select services.
Once parameters defined, click on “Apply” button.
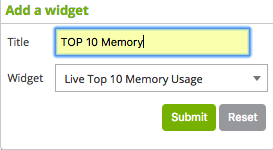
Click on “Add widget” button and select “Live TOP 10 Memory Usage” widget:
Edit the widget settings (wrench icon). In your case, we will select only event logs linked to ESX hostgroup:
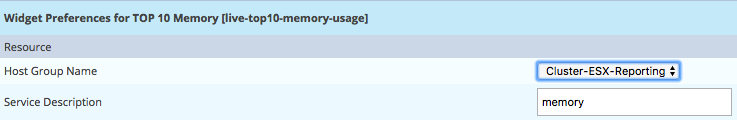
Once parameters defined, click on “Apply” button.
You can move widget by click on title and move your cursor to select a new column.
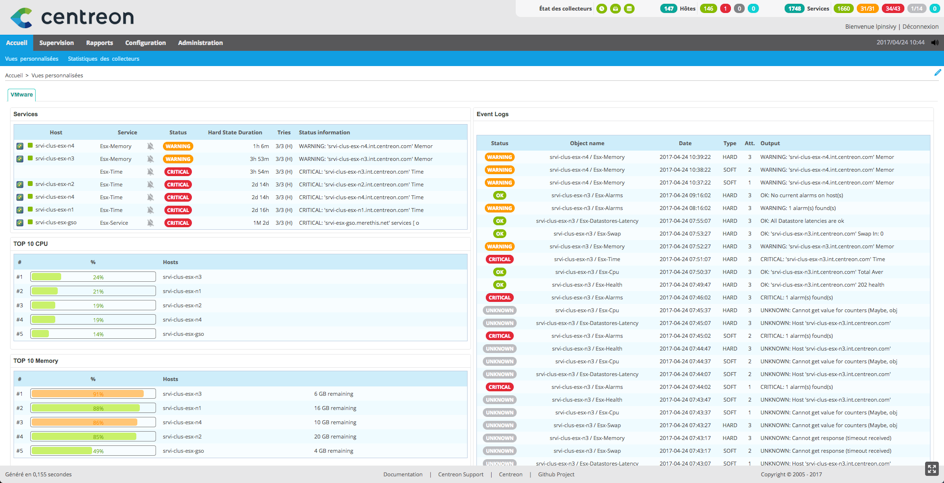
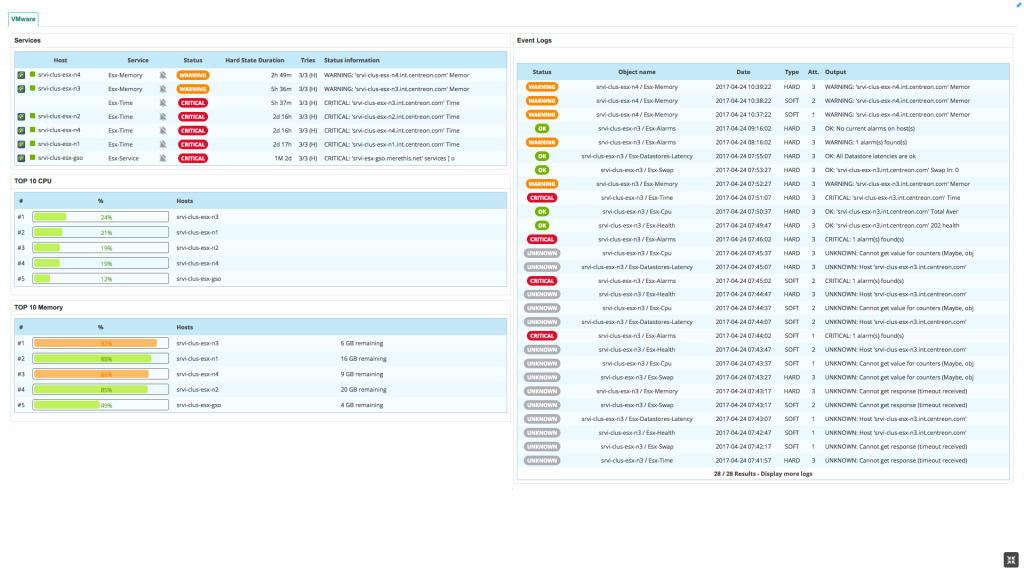
Click on the pen icon on the right to close edition mode. You have now a custom view to display services linked to ESX servers in your case:
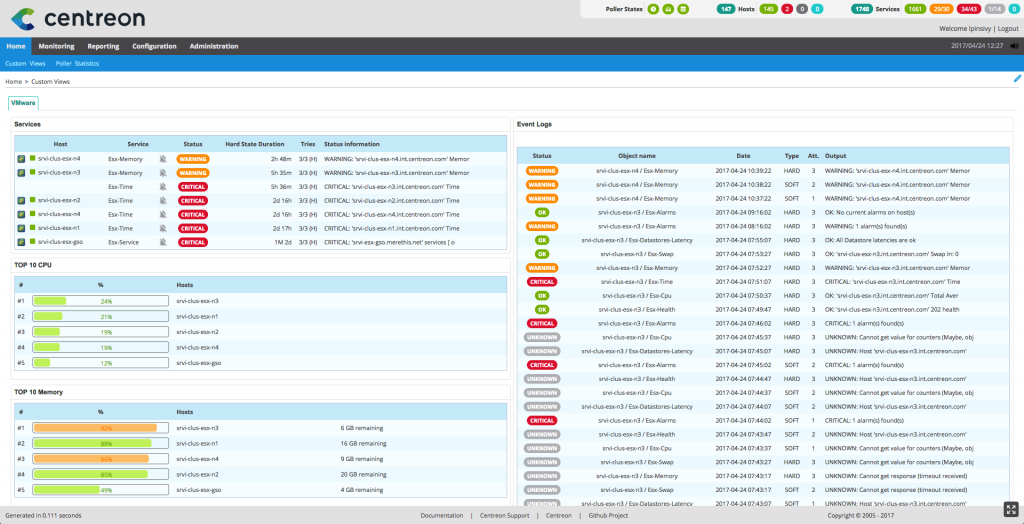
You can display this view in full screen by clicking on F11 keyboard or by clicking on full screen button located on the bottom left:
Several widgets are available:
- Grid-map: display status of services on a grid to compare identical services of different hosts;
- Widget-engine-status: display statistics of monitoring engine;
- Graph Monitoring: display chart of performance data of a service;
- Host Monitoring: display status of hosts;
- Hostgroup Monitoring: display status of hosts group by hostgroups;
- HTTP Loader: display external web page;
- Live Top 10 CPU Usage: display TOP 10 of CPU services consumption;
- Live Top 10 Memory Usage: display TOP 10 of memory services consumption;
- Event Logs: display event logs of monitoring;
- Service Monitoring: display status of services;
- Servicegroup Monitoring: display status of services group by servicegroups;
- Tactical Overview: display summary of services and hosts;
Enjoy your next custom view creation!
See the official release of the new Centreon 3.4 version.
Share