


You start using Centreon MBI and you want to generate your first insightful report ?
This tutorial has been made for you.
Thanks to it, learn how to use the product and generate your first report.
The process is simple :
- Define and specify your need
- Select the report template you need for your analysis by browsing the documentation
- Configure your report by “adding a job”
- Retrieve the report from the interface
Before starting this tutorial, make sure that your Centreon MBI platform is correctly configured and operational.
- Define and specify your need
Start from a very simple need which is often the starting point for using Centreon MBI: we want to monitor the availability of IT resources.
In our case, the Head of Europe Network explains us that routers seem sometimes unreachable and needs to analyze this. To meet his needs, we are going to retrieve the availability of our routers located in Europe.
The need is identified, move on to the next step.
- Select the report template
Every report template answers a specific need. In our case, we want to analyse the availability of our routers located in Europe.
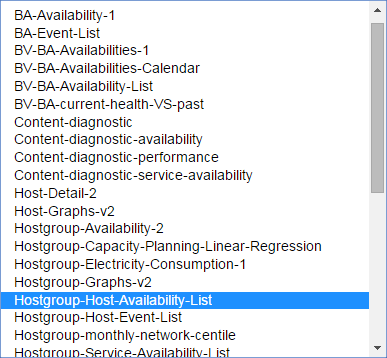
First, have a look on the page listing the report templates available, then select the following template : Hostgroup-Host-Availability-List. This template is listing the availability of groups’ hosts. In our case, the hosts monitored are our routers.
- Report configuration by “adding a job”
In Centreon MBI, you configure a report by creating a scheduled job. Go to menu: Reporting → Business Intelligence → Configuraton | Jobs / Add (for a new one):
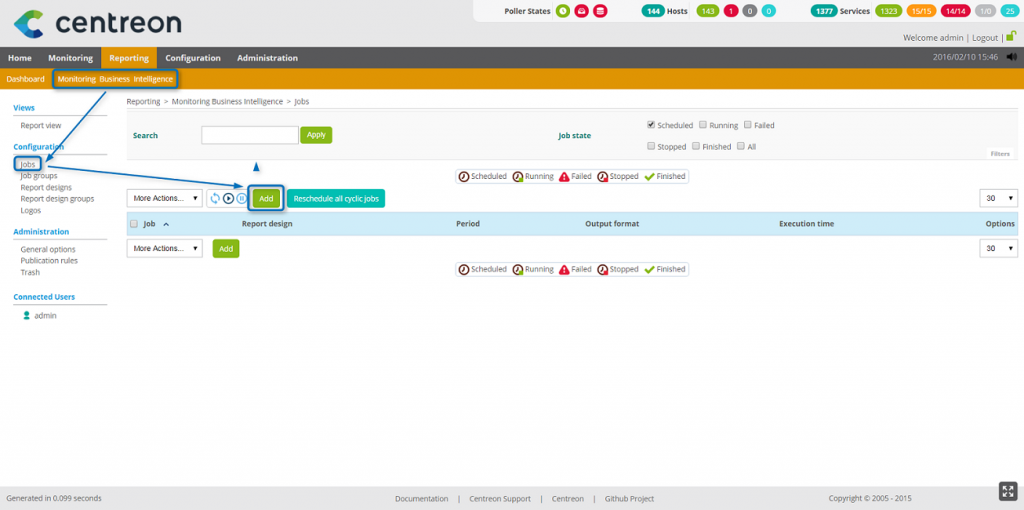
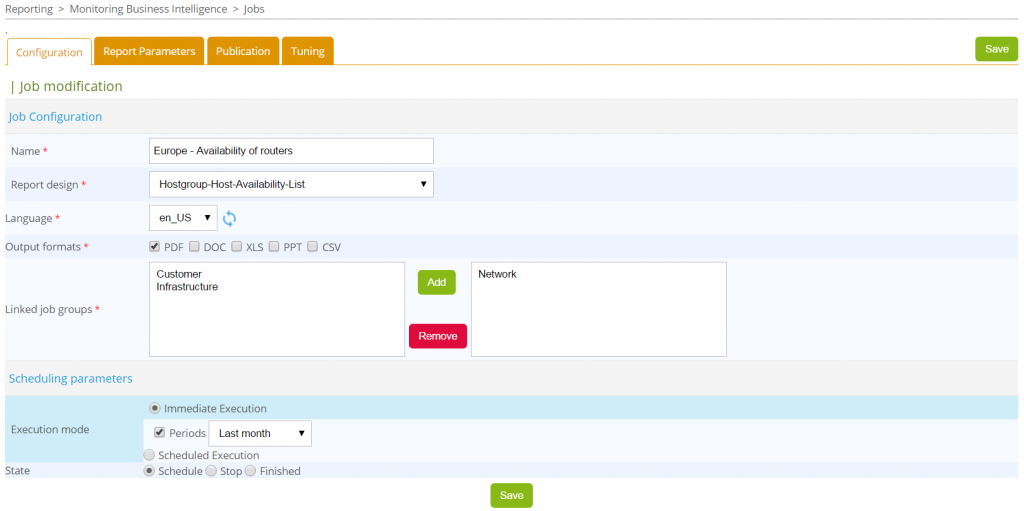
It opens the job creation form on the first tab:
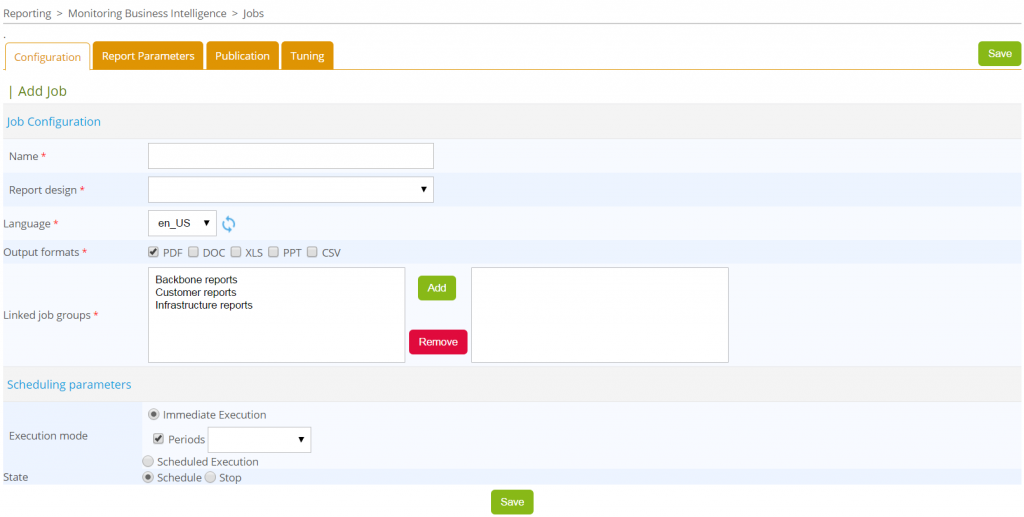
First, in the Job Configuration part, give a name to the job. This name is the name of the report to be generated.
N.B.: as you might have quickly dozens of jobs, it’s really important to define naming rules.
Then, choose:
- the report template , here it is Hostgroup-Host-Availability-List
- the language: English
- and the output format: PDF
You also have to link the job to a job group. This is mandatory regarding the rights and user profiles management.
In the Scheduling parameters part, choose the execution mode. You have the choice between an immediate execution and a scheduled execution. In our case, we are going to use the immediate execution in order to directly retrieve the report.
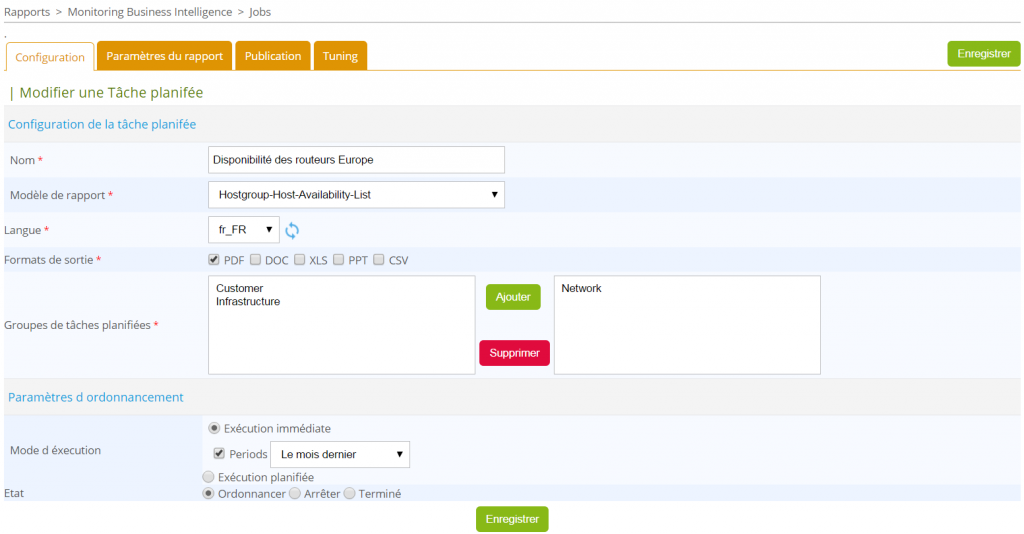
In the following configuration, the report will be generated immediately, in English, in PDF format, on the last month’s statistics:
When the Configuration tab is correctly filled, we can go to the “Report Parameters” tab. In this tab, we are going to choose the context on which the report will be generated. In our example, we choose to list the availability of hosts stored in the group “Routers” located in “Europe” (host category).
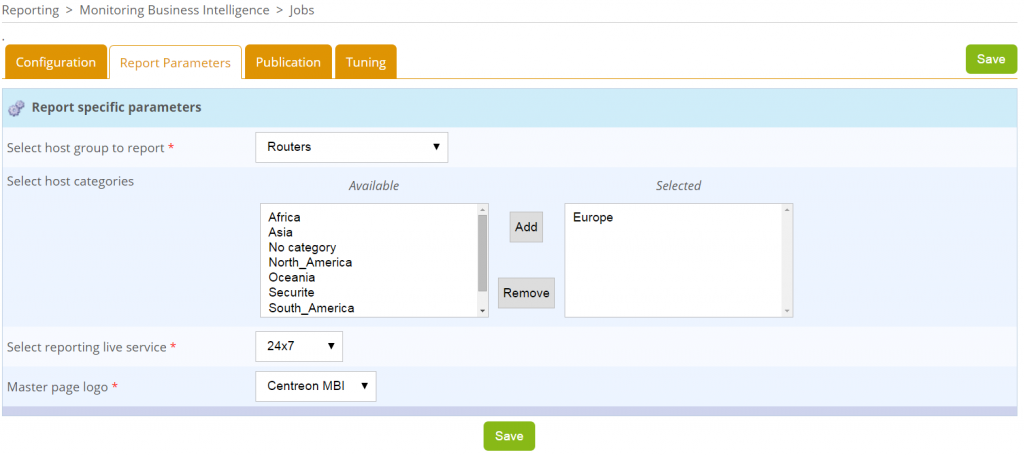
N.B.: for the majority of report templates, it is possible to select the time period on which the report will be generated.
Here, we want to analyze the routers’ availability on a 24×7 time period. To be available in the list, this time period has to be defined in Centreon and has to be configured in Centreon MBI’s general options, in the “ETL Options” tab.
Finally, customize the report with your logo. It’s possible to add new logos in the “Logo” menu of Centreon MBI.
By clicking on “Save”, the report is scheduled according to the selected mode: immediately.
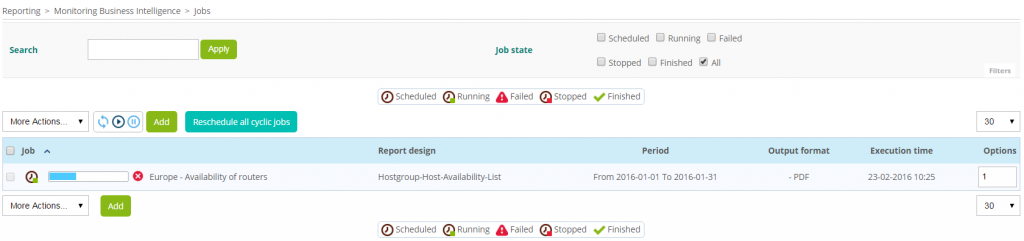
If you can’t see the job in the list, check the filter applied to the page. Select “All” to be sure to see all the jobs.
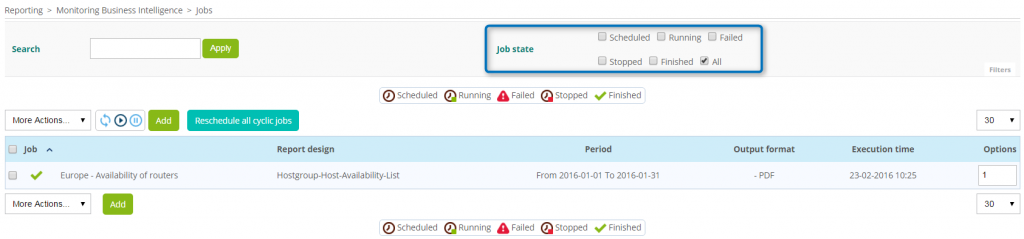
- Retrieve the generated report
Once the job is finished, go to Report view which contains the list of all reports generated. To visualize your report, simply download it by clicking on the format icon, in our case: PDF.
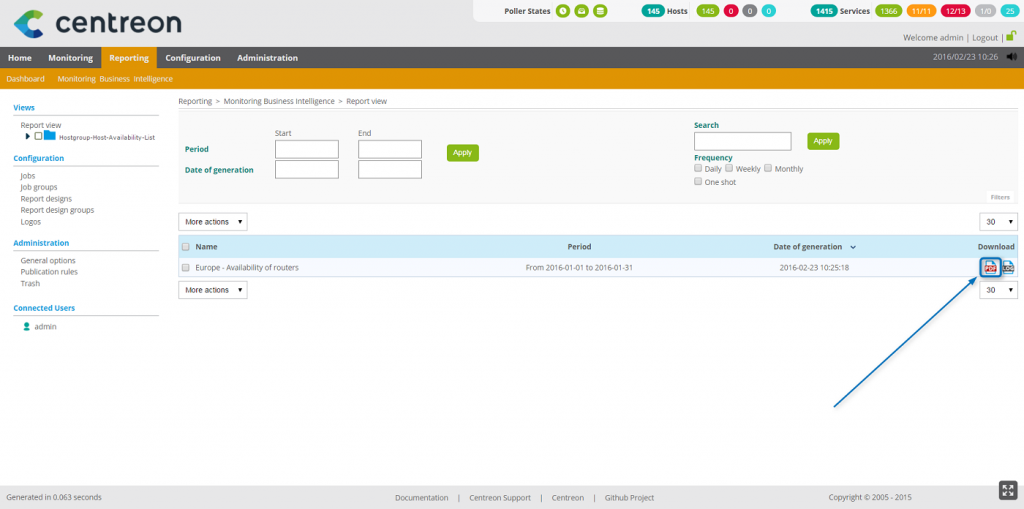
You have now access to the requested report displaying routers’ availability in Europe:
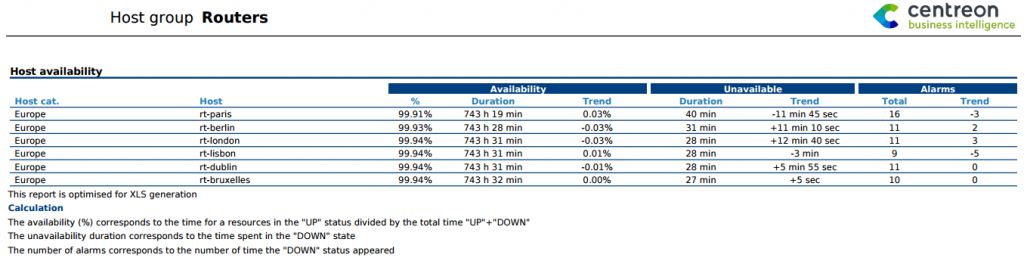
Bravo! Now you know how to extract simple statistics from the reporting base.
Ready to generate new reports? Go back to the report list page, select the templates that meet your IT reporting needs and generate new report by yourself!
We hope you enjoyed this tutorial!
Share


