


OpenTelemetry
Back to glossaryOpenTelemetry: An Open Source Standard for Observability
OpenTelemetry (often abbreviated as Otel or Opentelemetry) is an open‑source observability framework designed to collect and export telemetry data—metrics, logs, and traces—from cloud-native services and infrastructure. It evolved from a merger of the OpenTracing and OpenCensus projects, aiming to serve as a unified source of truth for distributed observability across languages and platforms.
Is OpenTelemetry still relevant?
Absolutely. OpenTelemetry is now the de facto standard, and its ecosystem continues to evolve—new collector contrib, SDK improvements, deeper support from Prometheus, Datadog, AWS, and Centreon. Instrumentation across languages (Python, Java, Go, .NET) and frameworks (Spring Boot, JavaScript) remains essential.
Where OpenTelemetry fits in the ITOPS and DEVOPS cycle
- Dev: Instrument code before deployment, using OpenTelemetry SDKs and span-based tracing.
- Test/Staging: Use the Otel Collector pipelines to validate data shape, correctness, and performance.
- Deploy/Run: In production, telemetry feeds into monitoring and incident response tools.
- Operate: Alerting, dashboards, and root cause analysis leverage spans, metrics, logs.
This integrates observability into continuous integration/delivery workflows and maintenance cycles.
OpenTelemetry main components
- Instrumentation libraries & APIs – Language-specific SDKs (such as Python, JavaScript, Java, Go, .NET, and Spring Boot) that enable applications to generate telemetry, including spans, events, logs, and metrics.
- Otel‑Collector – A vendor-neutral service that ingests telemetry from various agents or SDKs, processes it, and forwards it to exporters. With community‑built packages (collector contrib), it can filter, aggregate, or anonymize data.
- Exporters – Modules that transmit or “export telemetry data” to backends like Prometheus, Datadog, Splunk, AWS, or Centreon.
- Agents/SDKs – These run inside or alongside applications to automatically capture spans, logs, and metrics. They can also support proprietary agents that push data to a collector.
- Processors & Pipelines – Components within the Collector that bridge the gap between the APIs, enabling the batching, sampling, enrichment, and routing of telemetry.
Data comprised in OpenTelemetry
OpenTelemetry comprises three key data types:
- Metrics: numerical time-series data, such as CPU usage, request rates, latency, and error rates.
- Spans (Traces): represent operation units within requests, including start/end times, duration, and context. Spans may form root spans and carry attributes like service names.
- Logs: textual or structured records of events, error messages, stack traces, useful for troubleshooting.
OpenTelemetry data Use Cases
| Data Type | Contains | Use Case |
|---|---|---|
| Metrics | Request rate, latency, CPU/memory usage | Performance dashboards, resource optimization |
| Spans | Operation name, duration, parent/child structure | Visualize request flow, root cause analysis |
| Logs | Timestamps, event names, error messages | Debugging, incident investigation |
OpenTelemetry processes
Getting started with OpenTelemetry involves a clear and structured workflow that adapts to your technology stack and observability goals. From selecting the right SDK to deploying collectors and configuring export pipelines, each step brings you closer to full visibility across your systems. Whether you’re instrumenting applications manually or leveraging automatic integrations, OpenTelemetry provides the tools to collect, enrich, and export telemetry data with ease. Here’s how the process works—from setup to visualization.
OpenTelemetry: Where to start
- Choose your language: install the Opentelemetry SDK (e.g., Java OpenTelemetry, .NET OpenTelemetry).
- Add instrumentation for spans, metrics, logs.
- Install Otel‑Collector or use Centreon’s Telegraf/CMA.
- Configure export pipelines to target your monitoring tool (Datadog, Splunk, AWS, Prometheus via collector contrib).
- Deploy, visualize, and iterate.
What is involved in Otel instrumentation
- Enable SDK or agent in your application or service.
- Generate spans around critical operations, specifying event names and attributes (e.g., “query_db”, “http_request”).
- Record metrics via gauge or histogram instruments.
- Emit logs as part of error handling.
- Invoke exporters to send spans, metrics, and logs through pipelines to your observability backend.
How OpenTelemetry data is collected
- Automatic instrumentation: via frameworks like Python OpenTelemetry or Java/Go OpenTelemetry integrations.
- OS-level or sidecar agents: such as the Otel‑agent or Centreon’s Telegraf integration, which supports OTLP metrics.
- Collector pipelines: The Otel‑Collector ingests telemetry over OTLP, HTTP, or Prometheus formats (e.g., Prometheus vs OpenTelemetry), then batches, processes, and forwards data.
Telemetry metrics
Telemetry metrics are numerical data points that measure the performance, behavior, and resource usage of software systems. In the context of observability and OpenTelemetry, metrics help teams monitor the health and efficiency of applications and infrastructure.
Key Characteristics:
- Quantitative: Metrics represent measurable values (e.g., number of requests, CPU usage, response time).
- Structured: Typically include a name, timestamp, value, and attributes (tags/labels).
- Aggregatable: Unlike logs or traces, metrics can be summed, averaged, or otherwise aggregated over time.
Common Examples:
http.server.duration– measures the time taken to handle HTTP requestsprocess.cpu.usage– tracks CPU usage of an applicationmemory.usage– monitors memory consumptionrequest.count– counts how many times an endpoint is hit
Types of Telemetry Metrics:
- Counters: Monotonically increasing values (e.g., number of requests)
- Gauges: Values that can go up or down (e.g., memory usage)
- Histograms: Distributions of values (e.g., request durations)
- UpDownCounters: Values that can increase or decrease over time
Metrics are lightweight, real-time, and ideal for alerting and dashboard visualizations in observability platforms like Centreon, Prometheus, or Datadog.
Important tools for OpenTelemetry
The adoption of OpenTelemetry is driven by the need for vendor-agnostic instrumentation, richer observability, and simplified distributed trace analysis.
To implement OpenTelemetry effectively, organizations rely on a suite of essential tools that work together to collect, process, and visualize telemetry data. These tools enable seamless instrumentation, ensure flexible data routing, and support integration with popular monitoring platforms.
From language-specific SDKs and agents to powerful collectors and exporters, each component plays a vital role in delivering observability at scale. Below are some of the key tools that form the backbone of a successful OpenTelemetry setup.
- Language SDKs: Python, JavaScript, Java, Go, .NET, Spring Boot.
- Otel‑Collector and collector contrib packages.
- Exporters for Prometheus, Datadog, Splunk, AWS, Centreon.
- Agents like Otel agents or Centreon Monitoring Agent (CMA) using OTLP protocols.
- Visualization and alerting tools in your monitoring backend.
Other monitoring tools dependent on OpenTelemetry
Many other modern platforms adopt OpenTelemetry as the ingestion standard:
- Prometheus vs OpenTelemetry: While Prometheus uses its own exposition format, it supports OTLP via the collector.
- Datadog OpenTelemetry: Datadog supports OTLP pipelines and uses the Opentelemetry collector to ingest custom data.
- Splunk: Accepts OTLP via collector contrib, enabling trace correlation.
- AWS OpenTelemetry: AWS Distro for OpenTelemetry (ADOT) ship traces and metrics directly to AWS CloudWatch, X‑Ray, etc.
Why OpenTelemetry is important
OpenTelemetry is now the cornerstone of modern observability strategies. By offering a unified, vendor-neutral framework for collecting metrics, logs, and traces, it empowers organizations to gain deep visibility into complex systems. Whether you’re operating in the cloud, on-premises, or in hybrid environments, OpenTelemetry bridges the gaps between services, enabling faster troubleshooting, better performance optimization, and alignment with key business objectives such as uptime, compliance, and cost control. Here’s why it matters.
- Provides standardized collection of metrics, logs, and traces.
- Enables end-to-end visibility across microservices.
- Helps identify and resolve performance bottlenecks quickly.
- Works across different environments—cloud, on‑prem, hybrid.
- Aligns technical monitoring with business goals like uptime, compliance, and cost optimization.
Who may benefit from Otel in your organization
OpenTelemetry is designed for teams and organizations navigating the complexities of modern, distributed systems. Whether you’re a developer, DevOps engineer, SRE, or an observability enthusiast, Otel offers the flexibility and standardization needed to monitor applications across diverse environments. If you’re building cloud-native apps, managing microservices, or exploring open-source observability, OpenTelemetry is built with your needs in mind.
- Developers and DevOps teams building distributed applications.
- SREs requiring effective observability opentelemetry across microservices.
- Large organizations adopting open‑source observability technologies.
- Enterprises using cloud services (AWS, Azure) or container platforms (Kubernetes).
- Observability evangelists building playground for observability evangelists to test new instrumentation.
The risks associated with not using OpenTelemetry
- Blind spots in your application performance and infrastructure.
- Delayed incident detection due to fragmented data.
- Increased mean time to resolution (MTTR).
- Inconsistent observability tools causing integration issues and higher costs.
What is the Future of OpenTelemetry?
The future of OpenTelemetry (Otel) is not only bright—it’s pivotal to the evolution of observability in modern IT environments. As organizations increasingly adopt distributed systems, containers, microservices, and cloud-native architectures, the demand for standardized, vendor-agnostic observability grows. OpenTelemetry is emerging as the foundational layer powering this shift.
Consolidation as the Standard for Observability
OpenTelemetry is rapidly becoming the de facto standard for telemetry collection across metrics, traces, and logs. With the merger of OpenTracing and OpenCensus, the project unified fragmented efforts into a single, cohesive open source observability framework. Moving forward, major cloud providers, monitoring platforms, and APM vendors are aligning with the OpenTelemetry specification to ensure compatibility and interoperability. This includes support for OTLP (OpenTelemetry Protocol) and seamless integration via OpenTelemetry Collector contrib packages.
Expanding Language and Platform Coverage
Support for additional programming languages and environments is a key area of growth. While popular stacks such as Python, JavaScript, Java, Go, .NET, and Spring Boot already have mature SDKs, work continues to expand coverage and improve automatic instrumentation. Expect deeper integration with emerging technologies, including serverless frameworks, edge computing platforms, and WASM-based runtimes.
Enriched Data and AI-Driven Observability
Future iterations of OpenTelemetry will focus on capturing richer telemetry data with better context: enhanced spans, improved trace context propagation, and more detailed logs for troubleshooting. This granular visibility lays the groundwork for AI-driven observability—enabling anomaly detection, automated root cause analysis, and predictive alerting based on unified, structured data.
Simplified Deployment and Management
As adoption grows, ease of use will be a priority. Expect the OpenTelemetry Operator to simplify Kubernetes deployments and manage instrumentation across services more efficiently. Community-led initiatives will continue to improve the collector configuration, auto-discovery features, and packaging of the OpenTelemetry collector to make onboarding faster for organizations of all sizes.
Broader Industry Adoption and Governance
The CNCF’s ongoing stewardship ensures a transparent, community-driven development model. Industry adoption is strong and growing across DevOps, ITOps, SREs, and even business-level decision-makers looking to align observability with business goals. As telemetry becomes a strategic asset, organizations will increasingly view OpenTelemetry as their source of truth for application performance and reliability.
Integration with Security and Compliance
Looking ahead, OpenTelemetry will likely play a growing role in supporting observability-driven security—offering insights into abnormal behaviors, request patterns, and infrastructure drift. Coupled with strong logging and tracing, this opens the door to compliance monitoring and forensic investigations powered by OpenTelemetry data.
This section helps position OpenTelemetry as future-proof, scalable, and aligned with enterprise needs. Let me know if you’d like to add visuals or embed specific Centreon capabilities here.
Explaining OpenTelemetry to a non-technical person
Imagine our IT systems are like a fleet of delivery trucks. We want to know where each truck is (tracing), how much fuel it’s using (metrics), and any issues it encounters like engine alerts or roadblocks (logs). OpenTelemetry allows us to install smart sensors (OTel agents) on the trucks that collect this data and send it back to a central garage. This helps us see if all trucks are running smoothly or intervene when something goes wrong. In business terms, it supports our goals by reducing downtime, improving service reliability, and ensuring our applications run efficiently.
How Centreon does OpenTelemetry
Centreon supports OpenTelemetry natively via:
- Telegraf Agent support – Centreon’s OpenTelemetry processor allows it to understand data sent in OpenTelemetry format.
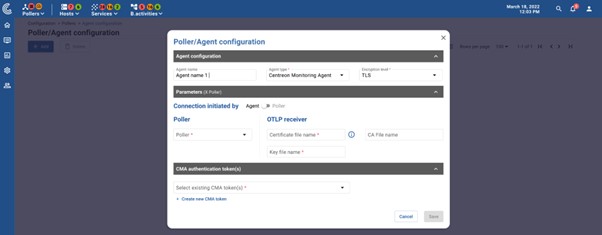
- Centreon Monitoring Agent (CMA) – a beta cross-platform OTLP agent that replaces NRPE/NSClient and sends telemetry using the Otel protocol. Learn more about the Centreon Monitoring Agent or join the OpenTelemetry and Agent beta program.
Centreon 24.10 LTS also ships new dashboards and native support for OTel telemetry.
Read this news release on native OTEL in Centreon for strengthened observability.
You may also check out these OTEL tutorials and resources
- How to monitor OTEL metrics with the Telegraf Agent.
- Telegraf integration guide.
- How to deploy and use Centreon Monitoring Agent
FAQ
What is OpenTelemetry?
A unified specification and set of tools for instrumenting, collecting, and exporting telemetry data across various platforms and languages.
What is OpenTelemetry used for?
OpenTelemetry captures distributed telemetry—metrics, spans, logs—to help monitor, debug, and optimize modern, microservices-based applications.
How do you use OpenTelemetry?
Use language-specific SDKs or agents to generate telemetry, configure a collector pipeline to process and forward data, then direct it into your monitoring stack.
What is JavaScript OpenTelementry?
JavaScript OpenTelemetry is the implementation of the OpenTelemetry observability standard for JavaScript-based applications. It enables developers to instrument their frontend (browser) and backend (Node.js) applications to generate and collect traces, metrics, and logs, providing visibility into application behavior across distributed systems.
OpenTelemetry vs Prometheus – what’s the difference?
Prometheus mainly handles metrics. OpenTelemetry is broader—collecting metrics, traces, logs. It can send metrics to Prometheus via the Otel Collector.
What is the difference between OpenTelemetry and Datadog?
OpenTelemetry is vendor-neutral instrumentation and telemetry transport. Datadog is an observability platform and backend; it consumes telemetry via OTLP and enriches it with features like APM and infrastructure monitoring.
What is the difference between OpenTelemetry and Splunk?
Splunk is a proprietary log‑ and APM‑centric backend. OpenTelemetry is a telemetry collection standard. Splunk accepts Otel input via the collector for richer trace/metric/log correlation.
What is Python OpenTelemetry?
Python OpenTelemetry is the official implementation of the OpenTelemetry standard for the Python programming language. It provides libraries and APIs that allow developers to instrument their Python applications and generate telemetry data—namely traces, metrics, and logs—to observe and monitor application behavior in real time.
How does OpenTelemetry work?
Applications emit spans, logs, and metrics to agents or SDKs, which send them to the Otel‑Collector. The collector loads processors and exporters to format and forward the data.
Is OpenTelemetry ready for production?
Yes. Core SDKs, collector, exporters, and wide industry adoption (including Centreon, AWS, Datadog, Splunk) make it production-ready.
What is the OpenTelemetry Collector?
A standalone service that centralizes telemetry intake, batching, filtering, transformation, and exporting to monitoring backends.
What is OpenTelemetry collector contrib?
OpenTelemetry Collector Contrib is the community-maintained distribution of the OpenTelemetry Collector. It includes all the core Collector features plus a wide range of additional receivers, processors, exporters, and extensions contributed by the OpenTelemetry community.
These contrib components enable support for more third-party systems (e.g., Apache, AWS, MongoDB, Kafka), enhance telemetry processing capabilities (e.g., filtering, redaction, custom routing), and make it easier to integrate OpenTelemetry with diverse observability backends.
It’s ideal for organizations that need more flexibility and integration options beyond the core Collector.
What is OpenTelemetry .NET?
The .NET SDK for OpenTelemetry allows tracing, metrics, and logging in .NET applications—often used with ASP.NET and Windows environments.
What is OpenTelemetry logging?
Structured logging integration that bridges logs with spans and metrics, enabling powerful root cause analysis.
What is the OpenTelemetry API?
A language-specific interface for creating and controlling telemetry data: spans, metrics, events, and exporting pipelines.
What is the OpenTelemetry Operator?
A Kubernetes controller that deploys and manages Otel‑Collector and instrumentation settings in Kubernetes environments.
What is the OpenTelemetry SDK?
The implementation library accompanying the API, including default processors, exporters, and sampling policies for different languages.
When was OpenTelemetry created?
It started in 2019 as a merge of OpenTracing and OpenCensus, with its first stable release in 2021.
Where does OpenTelemetry store data?
OpenTelemetry doesn’t store data—it forwards it via exporters to backends like Prometheus, Centreon, Datadog, Splunk, or AWS.
Why is OpenTelemetry important for Java applications?
Java is heavily used in microservices. OpenTelemetry Java provides built-in instrumentation and trace/metric collection to observe distributed Java-based systems.
What does OTEL OpenTelemetry stand for?
Shorthand for OpenTelemetry, OTEL is a common abbreviation which stands for Open Telemetry Framework. It’s an open-source project under the Cloud Native Computing Foundation (CNCF) that provides a set of standardized tools, APIs, and SDKs to collect, generate, process, and export telemetry data — including metrics, logs, and traces — from cloud-native applications.

Ready to see how Centreon can transform your business?
Keep informed on our latest news