


Connecting Centreon to Prometheus through the Plugin Pack centreon-pack-cloud-prometheus-api allows you to use the metrics collected by Prometheus directly in Centreon. You can centralize data collection results and send alerts from within Centreon.
With its collection mechanisms and capabilities to integrate into numerous containerization and orchestration stacks, Prometheus brings great agility in the collection of ephemeral and/or dynamic data.
The PromQL language optimizes queries for the collected data, and the Prometheus integration with Centreon is based on that concept. Read this article to make the most of it.
Connect Prometheus with Centreon to get a 360-degree vision, from cloud to the edge
You have surely read the State of IT Monitoring conducted by the independent firm Vanson Bourne for Centreon.
This survey, carried out among 600 IT professionals worldwide, reveals that 14 IT monitoring tools on average are used in IT Departments and that the first expectation in terms of monitoring tools is its interoperability and its ability to integrate into its IT ecosystem.
Henri Ford once said: “Getting together is a start, staying together is progress, working together is success”. Today we are offering you the opportunity to have Centreon work together with Prometheus, a particularly powerful solution for storing metrics from the native cloud and containers. By interfacing Centreon with this tool, and by integrating the metrics from Prometheus into the Centreon monitoring platform, you will have better visibility. You can thus exploit the qualities of these two tools, consolidate the data collected in a single console and issue alerts centrally. Isn’t life beautiful?
|
|
|
|
Metric-oriented |
Status, alert and monitoring oriented |
|
Low check frequency over HTTP and short-term approach to data storage and visualization |
Historicalization and data aggregation capability |
|
Native container, large library of node exporters, easy deployment in K8 clusters |
Cloud-to-edge visibility, access to metrics and alerts in a single console |
Connecting Prometheus with Centreon gives you a 360-degree view of your cloud-to-edge infrastructures and applications no matter how they are deployed or orchestrated.
The centralization of collection and alerting in Centreon offers:
- A better visibility, all the people using the solution have access to all the indicators collected through your various tools,
- A better exploitation of IT and business information by correlating and sharing all your data collected through the modules of the Centreon Business solution.
Centralizing collected data and alerts in Centreon provides the following benefits :
- More visibility: Anyone using the solution can access all collected indicators through their various tools
- Optimal use of IT and business information: You can correlate and share all of the data collected with the help of the Centreon Business Edition modules
Step 1: Setup and deployment of the Prometheus Server Plugin Pack
To use the Prometheus metrics in the Centreon console, you need to first install the required components to run the Prometheus Server Plugin Pack. This is done in two steps.
On your Central Server, install the RPM package to obtain Monitoring Templates:
yum install centreon-pack-cloud-prometheus-api
Through the “Configuration > Plugin Packs > Manager” menu, search for Prometheus and use the “+” sign to activate the Plugin-Pack.
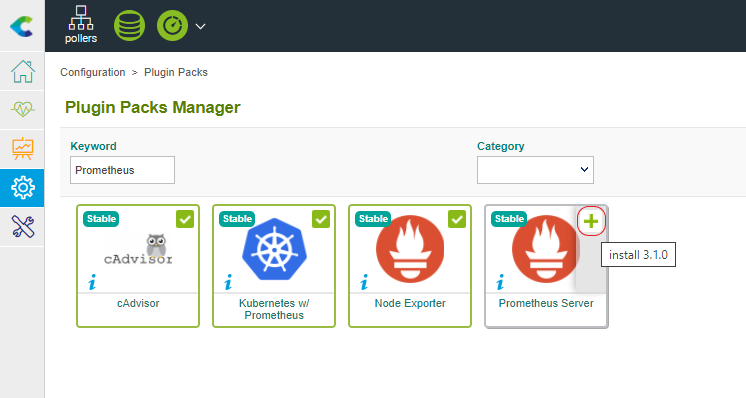
Note: If you’re using IT-100 free license, IT Edition, or any online subscription, you can directly go to the next step described below.
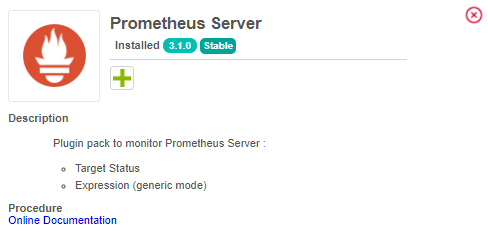
Once the Plugin-Pack is activated, its content and a link to the documentation become available.
On each Poller expected to use PromQL to query Prometheus Server, install the Plugin:
yum install centreon-plugin-Cloud-Prometheus-Api
Step 2: Configure your Prometheus Host in Centreon
The configuration of a Prometheus Server is similar to any other Host configuration.
Use the Add button in the “Configuration > Hosts” menu, apply the “Cloud-Prometheus-Api-Custom” Template then define all the relevant parameters.
The screenshot below shows a Host configuration for a Prometheus Server which FQDN is “amzprometheus.int.centreon.com” with a v1 API listening on the 80/HTTP port.
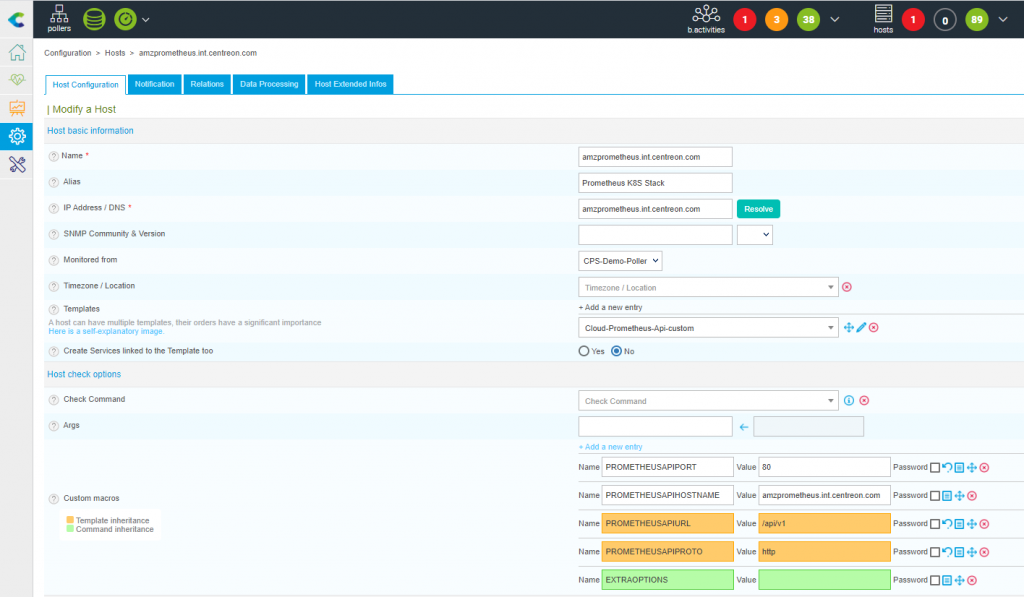
These parameters need to be adjusted to your environment.
Then, enable the “Create Services associated to Template” checkbox and save your configuration.
Deploy the configuration to obtain the default monitoring including a Ping and the Status of the Targets associated with your Prometheus instance.
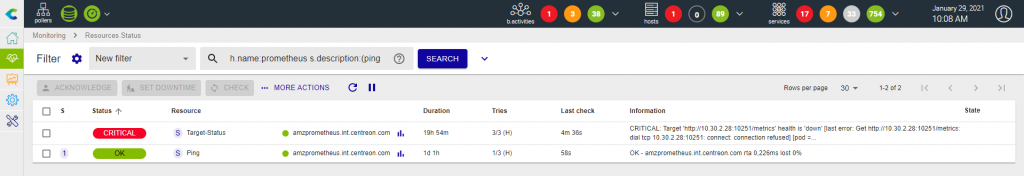
The connector works correctly and it detects above a CRITICAL on the status of one or more Targets defined at Prometheus level that are not seen as “up”.
This is an interesting indicator but we will see that this connector also allows us to do much more powerful things by querying the data collected through these Targets.
Step 3: Monitor nodes CPU metrics aggregating several containers metrics and PromQL queries in one single Centreon Service
Context and metrics
cAdvisor is a famous tool to expose metrics about containers’ health, but these are mainly raw metrics that require additional operations to be easier to interpret and apply thresholds.
When it comes to CPU utilization, metrics are essential because they can be used as conditions to pop new containers. This is a capability Kubernetes relies on, let’s see how to track these metrics whatever the dimension is relevant for your specific use case.
Prometheus scraps tons of CPU-related metrics through cAdvisor Targets. Here are the metrics we will focus on:
- container_cpu_usage_seconds_total: number of CPU seconds used by a container
- container_cpu_cfs_throttled_seconds_total: number of seconds where CPU resource allocation to a container has been throttled
These metrics are counter, we’ll use PromQL to compare its evolution over time (rate() function) over a five minutes time frame ([5m]) and multiply its result by 100 to obtain a percentage (*100).
Metrics’ dimensions are also a great tool allowing to narrow the scope of a PromQL query. In this specific case, we will exclude ‘POD’ containers or without a namespace associated with them.
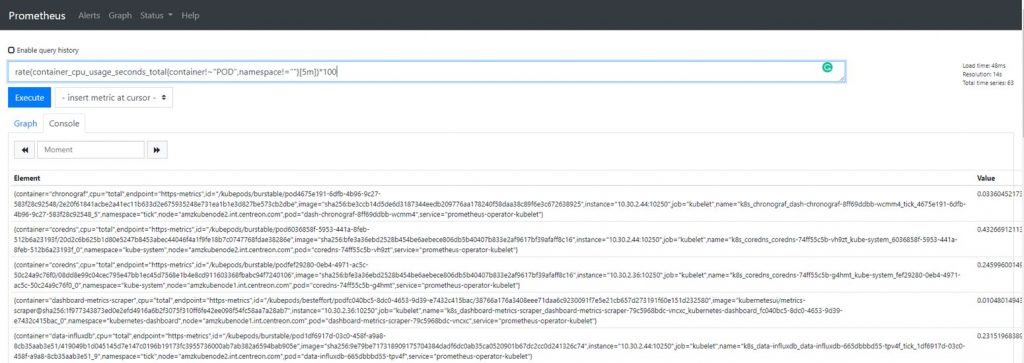
The resulting PromQL query for the container_cpu_usage_seconds_total metrics is:
rate(container_cpu_usage_seconds_total{container!~"POD",namespace!=""}[5m])*100
Try it through your Prometheus Query UI to check that it works as expected.
Build and test your check command_line
As stated in the Plugin Pack description, the Expression mode we will use is a generic check. It means it will allow you to do awesome stuff but requires some additional configuration.
It can be relevant to test the command_line through the shell using the centreon-engine user. Heavily recommended if it is your first contact with this Plugin.
As every Centreon-Plugins, you can use the –help flag to list all available option and their description:
/usr/lib/centreon/plugins/centreon_prometheus_api.pl --plugin=cloud::prometheus::restapi::plugin --mode=expression --help
To build the command, use these options to specify which mode the Plugin must load and how it can reach your Prometheus instance (–mode=expression –hostname=’amzprometheus.int.centreon.com’ –port=’80’ –-url-path=‘/api/v1’ –proto=’http’).
Then, use the –query option to define PromQL queries, you can define it multiple times.
(--query='utilization,rate(container_cpu_usage_seconds_total{container!~"POD",namespace!=""}[5m])*100' --query='throttled,rate(container_cpu_cfs_throttled_seconds_total{container!~"POD",namespace!=""}[5m])*100').
The –query option syntax (–query=”centreon_name,promql_expression”) has two different parts. The first one (centreon_name) is a centreon key definition that can be seen as a translation of the raw PromQL metric name (container_cpu_usage_seconds_total => utilization). The second one is a copy/paste of the PromQL you used in Prometheus UI, pretty straightforward isn’t it?
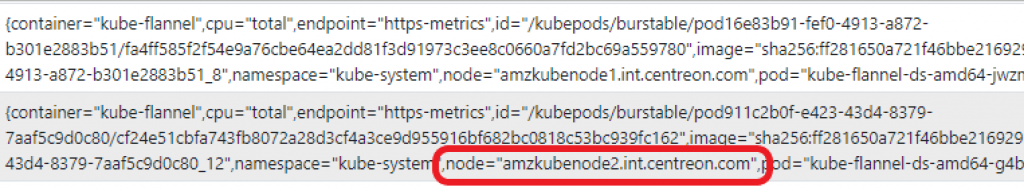
A metric has several dimensions and this is where the Connector delivers its full power. You can use the one that sounds the most relevant to you. Here we want to obtain the Nodes’ CPU metrics from each containers’ CPU metrics (–instance=node).
To make decisions easier when something goes wrong, the customization of the output message is possible and the centreon defined key through –query option will help make it dynamic.
You can personalize the message when only one node is checked or when a measure raises defined thresholds (–output=’Node %{instance} Average: %{utilization}%, Throttled: %{throttled}%’) or when several nodes are detected but everything’s OK (–multiple-output=’All nodes CPU metrics are OK’).
That’s it! Here is the command to be executed and the output expected when everything’s OK:
/usr/lib/centreon/plugins//centreon_prometheus_api.pl --plugin=cloud::prometheus::restapi::plugin --mode=expression --proto='http' --hostname=amzprometheus.int.centreon.com --url-path='/api/v1' --port='80' --query='utilization,rate(container_cpu_usage_seconds_total{container!~"POD",namespace!=""}[5m])*100' --query='throttled,rate(container_cpu_cfs_throttled_seconds_total{container!~"POD",namespace!=""}[5m])*100' --instance='node' --output='Node %{instance} Average (Last 5min): %{utilization}%, Throttled(Last 5min): %{throttled}%' --multiple-output='All CPU metrics are OK' --verbose --use-new-perfdata
OK: All CPU metrics are OK | 'amzkubemaster.int.centreon.com#utilization'=0.4481031485383696;;;; 'amzkubemaster.int.centreon.com#throttled'=2.4699414529294077;;;; 'amzkubenode1.int.centreon.com#utilization'=0;;;; 'amzkubenode1.int.centreon.com#throttled'=0;;;; 'amzkubenode2.int.centreon.com#utilization'=0;;;; 'amzkubenode2.int.centreon.com#throttled'=0;;;;
Node amzkubemaster.int.centreon.com Average (Last 5min): 0.4481031485383696%, Throttled(Last 5min): 2.4699414529294077%
Node amzkubenode1.int.centreon.com Average (Last 5min): 0%, Throttled(Last 5min): 0%
Node amzkubenode2.int.centreon.com Average (Last 5min): 0%, Throttled(Last 5min): 0%
Step 4: Configure the check using Centreon templates
Now it’s time to implement the previous command_line into Centreon:
- Go to the “Configuration > Services” menu and use Add button to create a new Service
- Set the description
- Attach the Service to your Prometheus Host (or any other host) that use “Cloud-Prometheus-Expression-Api-custom” template
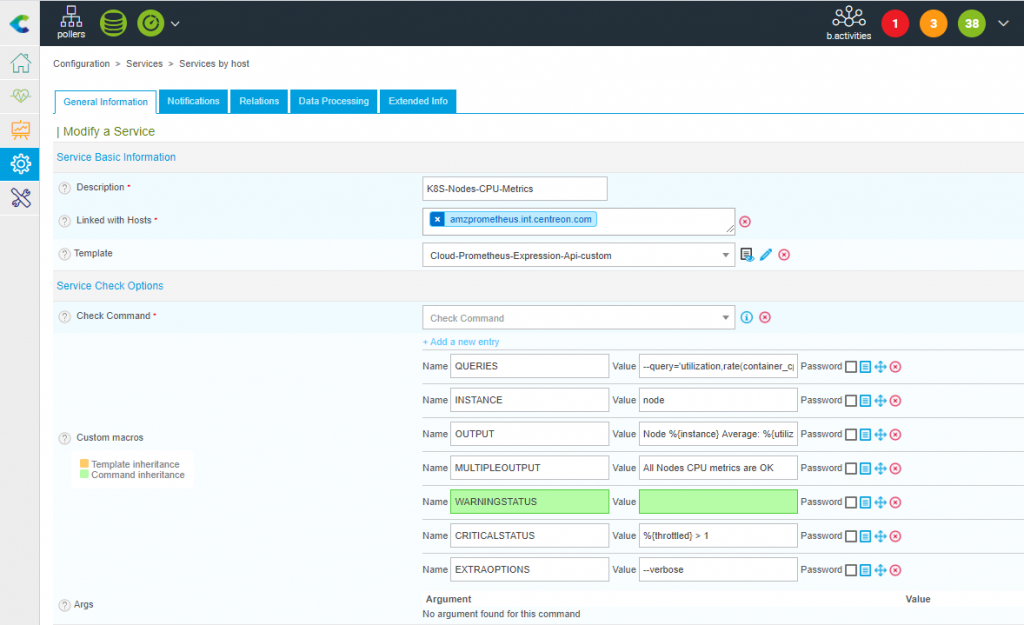
- Fill in the required Macros. Here is a tab summarizing the previous example:
|
Macro (name) |
Macro (value) |
Command line |
|
QUERIES |
–query=’utilization,rate(container_cpu_usage_seconds_total |
–query=’utilization,rate(container_cpu_usage_seconds_total |
|
INSTANCE |
node |
–instance=’node’ |
|
OUTPUT |
Node %{instance} Average (Last 5min): %{utilization}%, Throttled(Last 5min): %{throttled}% |
–output=’Node %{instance} Average (Last 5min): %{utilization}%, Throttled(Last 5min): %{throttled}%’ |
|
MULTIPLEOUTPUT |
All Nodes CPU metrics are OK |
–multiple-output=’All Nodes CPU metrics are OK’ |
|
CRITICALSTATUS |
%{throttled} > 1 |
–critical-status=’%{throttled} > 1′ |
The ‘CRITICALSTATUS’ Macro was not part of the initial command line and will allow triggering an alert if the Throttled CPU metric value is above 1:
Here is a screenshot of the Service configuration.
This Service will work when associated with a Prometheus Host or any other Host. The only requirement is that this Host:
- Use the “Cloud-Prometheus-Api-Custom” Template
- Have a Macro PROMETHEUSAPIHOSTNAME filled in with the Prometheus Server IP Address or FQDN
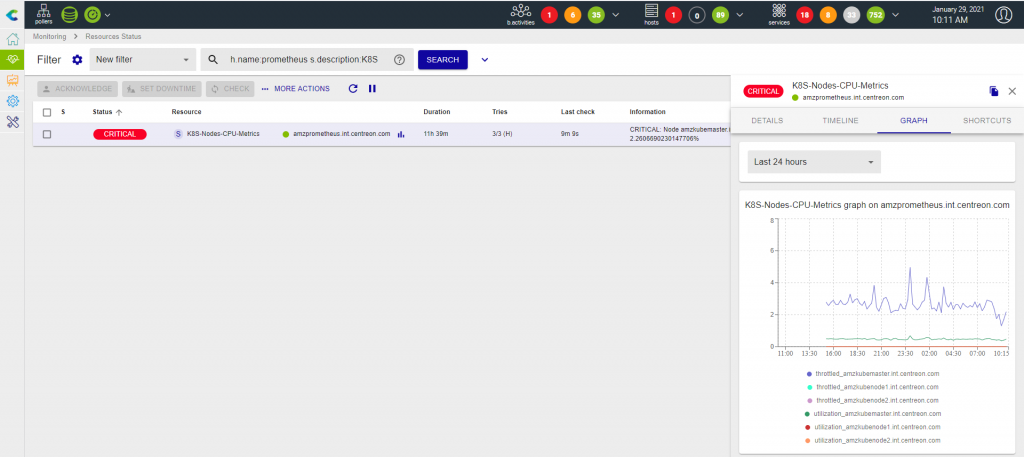
Now, deploy your configuration and enjoy!
Share


