

Since its beginning, Centreon allows to display charts from collected performance data. These charts use RRDtool as data support storage and those are available in Centreon Web interface.
Henceforth Centreon allows to export collected performance data to Time Series Databases (TSDB).
Discover our new tutorial in which we explain how to use the Graphite TSDB and view the data with the Grafana dashboard.
Tutorial context
In our example, we will use the following architecture:
- A Centreon server (10.1.1.1)
- A Graphite server based on Linux CentOS 7 (10.1.1.2)
Install a Graphite server
We will install and configure a Graphite server on CentOS 7 Linux distribution. We will use available package from EPEL repository.
To add EPEL repository run command:
yum install -y epel-release
Then, install Graphite with their web interface to perform tests with command:
yum install -y httpd graphite-web python-carbon perl
Initialize graphite-web interface:
/usr/bin/graphite-manage syncdb --noinput

/usr/bin/graphite-build-index

/usr/bin/chown -R apache:apache /var/lib/graphite-web
Start carbon storage:
systemctl start carbon-cache
Apache manage the graphite-web interface so we need to modify default files from CentOS 7. Those modifications are done for this example, you need to adapt those on production environment.
Comment all lines in /etc/httpd/conf.d/welcome.conf file.
Then, edit /etc/httpd/conf.d/graphite-web.conf file to allow everybody to access to Graphite as default web site.
Comment ServerName graphite-web line to access to Graphite by default.
To allows to everybody to access apply following changes:
- Require local
- Require all granted
And
- Deny from all
- Allow from 127.0.0.1
- Allow from ::1
- Allow from all
You must have default file:
# Graphite Web Basic mod_wsgi vhost

<VirtualHost *:80>

    # ServerName graphite-web

    DocumentRoot "/usr/share/graphite/webapp"

    ErrorLog /var/log/httpd/graphite-web-error.log

    CustomLog /var/log/httpd/graphite-web-access.log common

    # Header set Access-Control-Allow-Origin "*"

    # Header set Access-Control-Allow-Methods "GET, OPTIONS"

    # Header set Access-Control-Allow-Headers "origin, authorization, accept"

    # Header set Access-Control-Allow-Credentials true

    WSGIScriptAlias / /usr/share/graphite/graphite-web.wsgi

    WSGIImportScript /usr/share/graphite/graphite-web.wsgi process-group=%{GLOBAL} application-group=%{GLOBAL}

    <Location "/content/">

        SetHandler None

    </Location>

    Alias /media/ "/usr/lib/python2.7/site-packages/django/contrib/admin/media/"

    <Location "/media/">

        SetHandler None

    </Location>

   <Directory "/usr/share/graphite/">

       <IfModule mod_authz_core.c>

           # Apache 2.4

           Require all granted

       </IfModule>

       <IfModule !mod_authz_core.c>

           # Apache 2.2

           Order Deny,Allow

           Allow from all

       </IfModule>

   </Directory>

</VirtualHost>
Restart httpd service:
systemctl restart httpd
Open ports on firewall for HTTP and carbon:
firewall-cmd --zone=public --permanent --add-service=http

firewall-cmd --zone=public --permanent --add-port=2003/tcp

firewall-cmd --reload
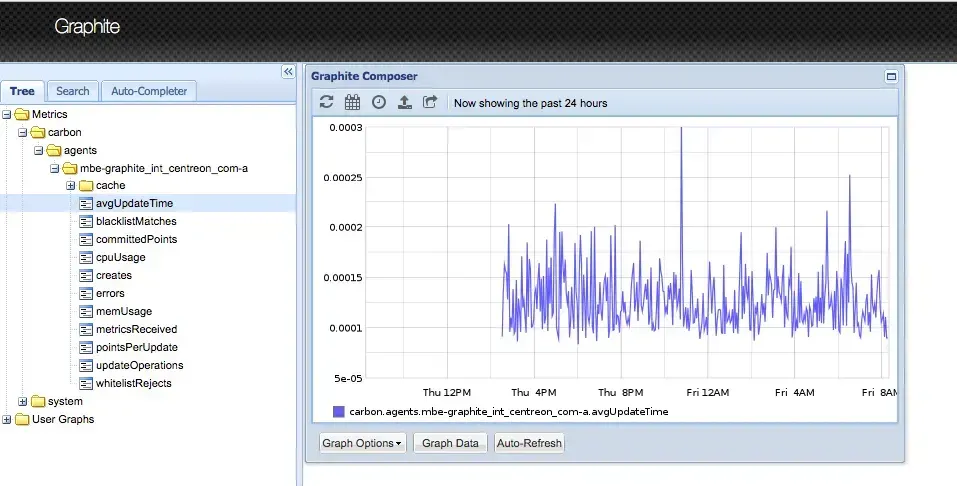
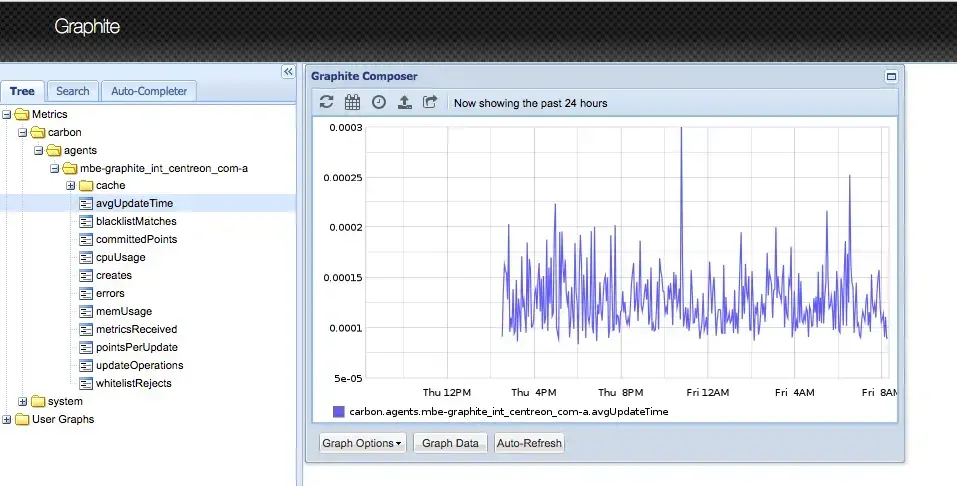
To test carbon and graphite-web access you have to open a web browser and connect to URL. In this example: http://10.1.1.2
Link configuration between Centreon and Graphite
For this part, we will use an already running Centreon server in Centreon 3.4 version. If you don’t have a Centreon server in version 3.4 you can download it here.
First, install Graphite module for Centreon Broker:
yum install -y centreon-broker-graphite
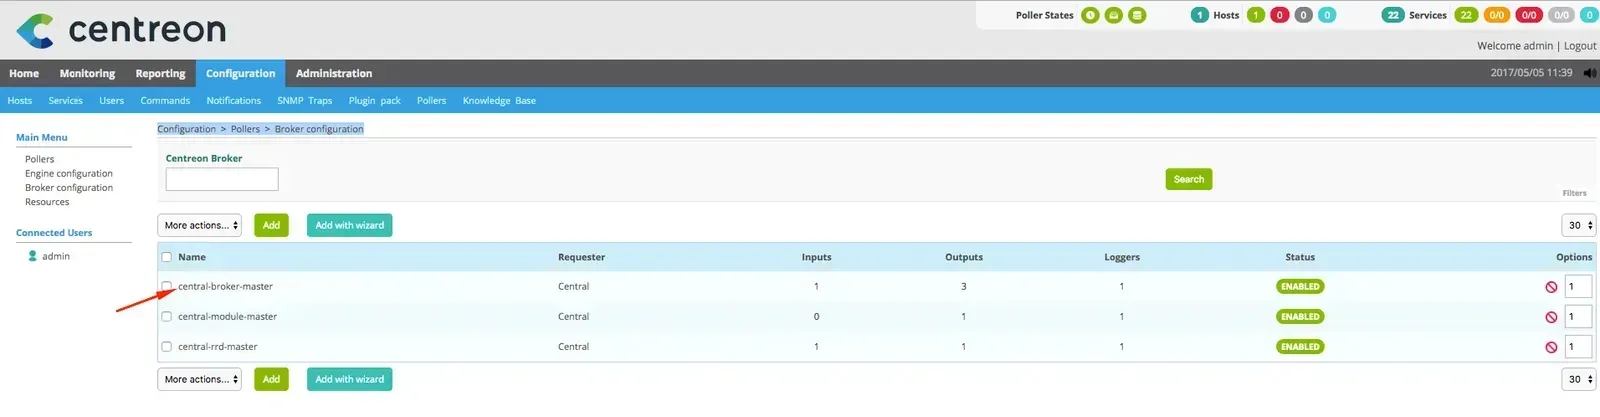
You need to add a new output to central-broker-master configuration. Go on “Configuration > Pollers > Broker configuration” menu.
Edit central-broker-master configuration:
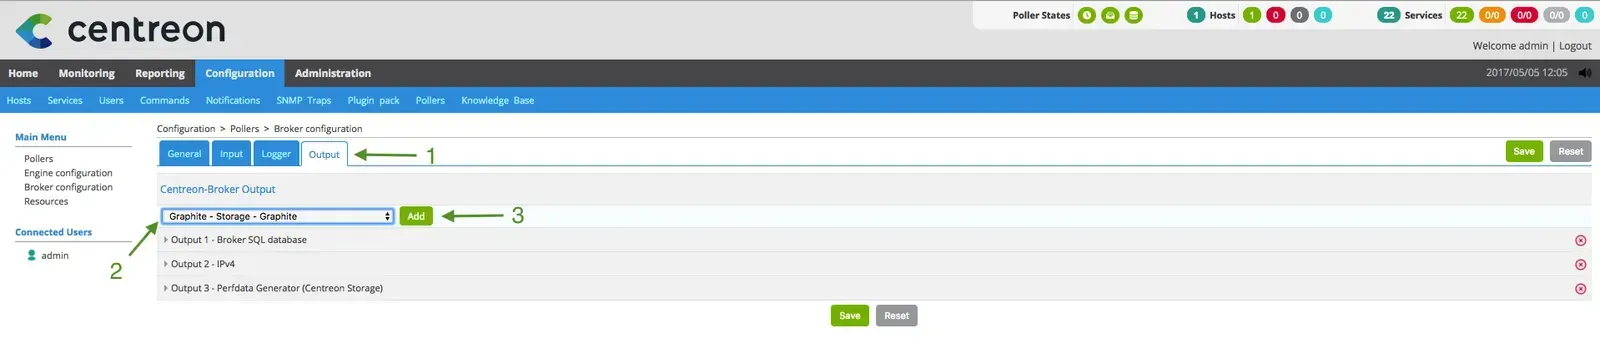
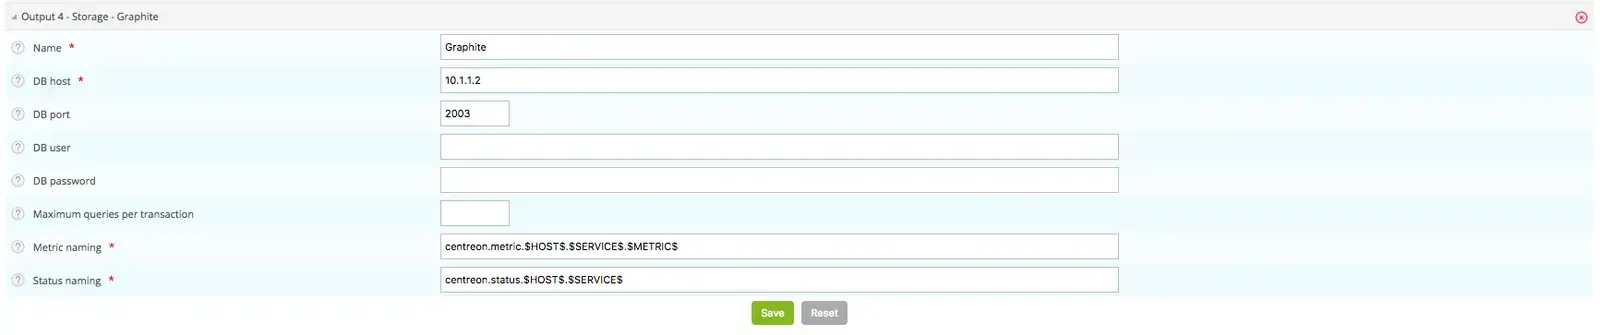
On “Output” tab, add a “Graphite” output:
And complete form.
- The “Name” could be: Graphite
- “DB host” is our Graphite server: 10.1.1.2.
- DB port is the carbon default port: 2003
- “DB user” and “DB password” must be empty because we didn’t set authentication on Graphite server
- “Metric naming” and “Status naming” allows to define metrics name. For more information refer to Centreon Broker documentation
In this example we define centreon.metric.$HOST$.$SERVICE$.$METRIC$ as metrics’ name. $HOST$ macro will be replaced by host name, $SERVICE$ by service name and $METRIC$ by the name of metric. For example, metric “load1” of “Load” services linked to “Centreon-Server” server by be: centreon.metric.Centreon-Server.Load.load1.
Notice: “.” Is the separator char.
For status we will use centreon.status.$HOST$.$SERVICE$. For example: centreon.status.Centreon-Server.Load
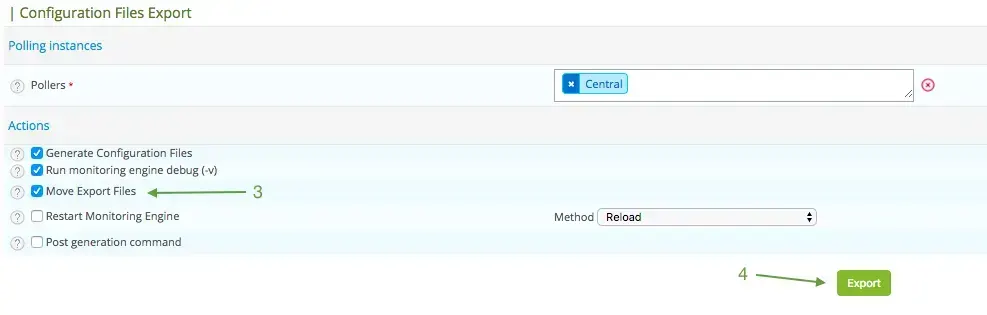
Once configuration complete, generate configuration and export it:

 To load first time Graphite module into Centreon Broker you have to run following commands in this order:
service cbd restart
service centengine restart
After few minutes, metrics from Centreon will be appear in Graphite.
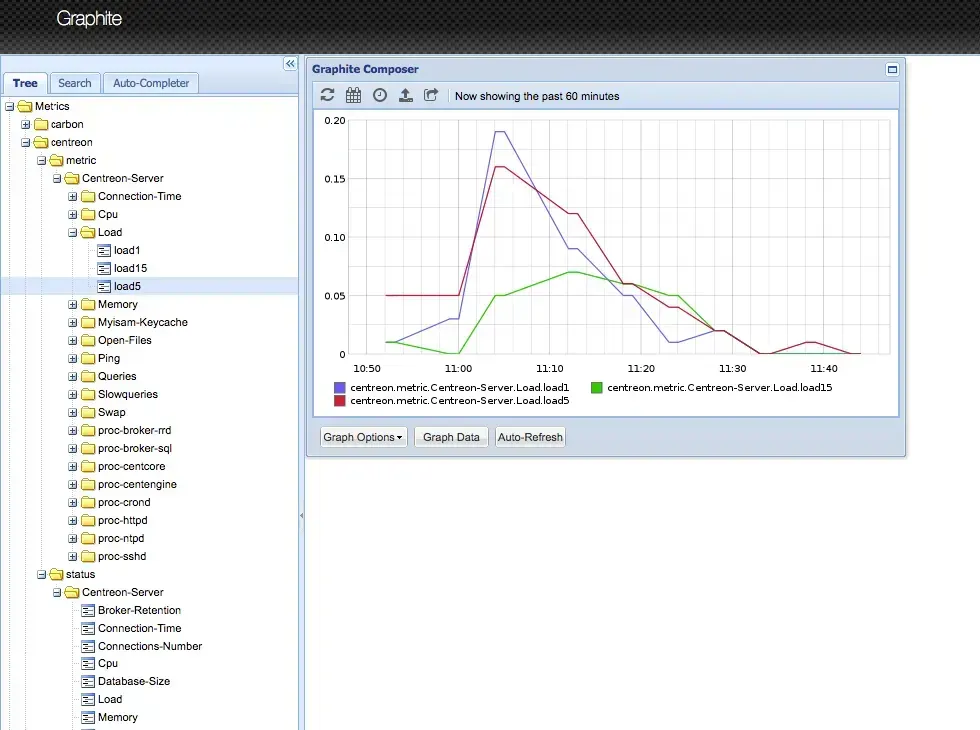
In bonus
We will install Grafana dashboard on Graphite server to handle data. We will follow official Grafana procedure.
First, add Grafana repository on your Graphite server:
[grafana]
name=grafana
baseurl=https://packagecloud.io/grafana/stable/el/7/$basearch
repo_gpgcheck=1
enabled=1
gpgcheck=1
gpgkey=https://packagecloud.io/gpg.key
https://grafanarel.s3.amazonaws.com/RPM-GPG-KEY-grafana
sslverify=1
sslcacert=/etc/pki/tls/certs/ca-bundle.crt
Then, install Grafana and start it:
yum install -y grafana
systemctl start grafana
You must open Grafana dashboard port on firewall:
firewall-cmd --zone=public --permanent --add-port=3000/tcp
firewall-cmd --reload
Open your web browser and go http://10.1.1.2:3000/login. Login and pasword are admin.
You will configure a data source to use Graphite data. The name of this data source will be Centreon and localhost as url:

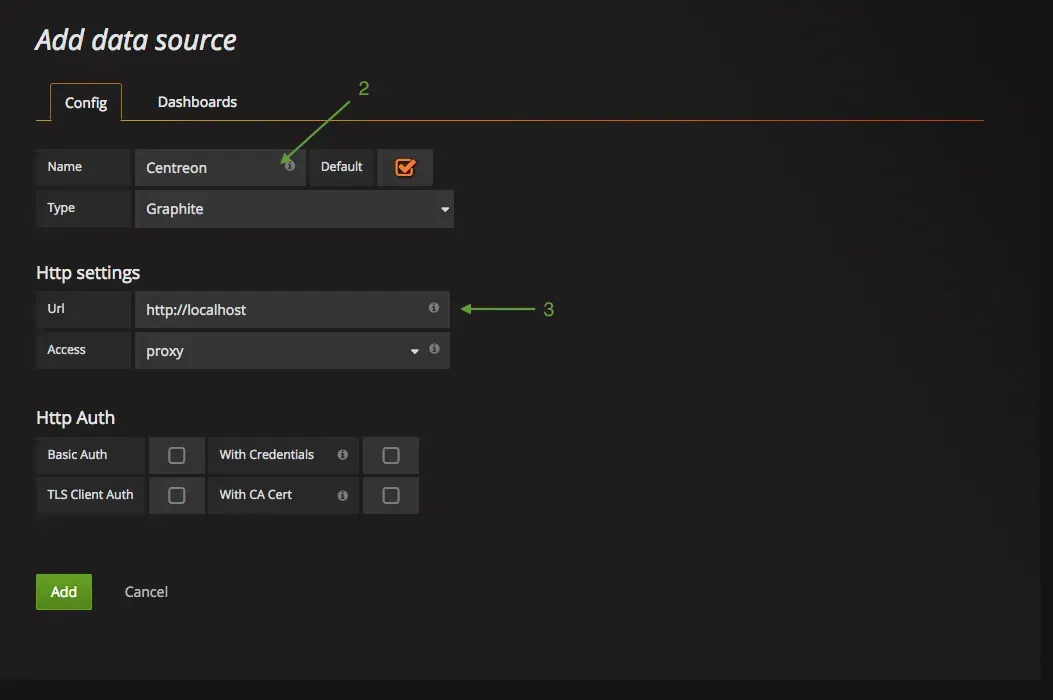
Create your first dashboard.

On one line, add load chart and its status.
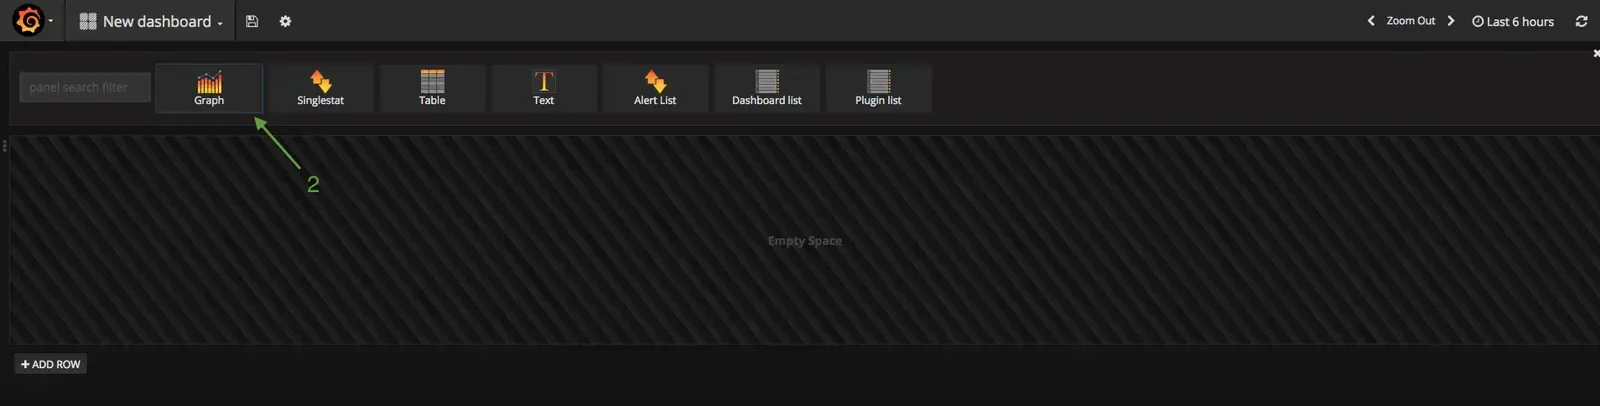
Name you chart like “Centreon-Server – Load” and set 10 as span. In Grafana the size of a line is 12 span.

Choose centreon.metric.Centreon-Server.Load.* metric. “*” is a joker character allowing to select all metrics of load service.
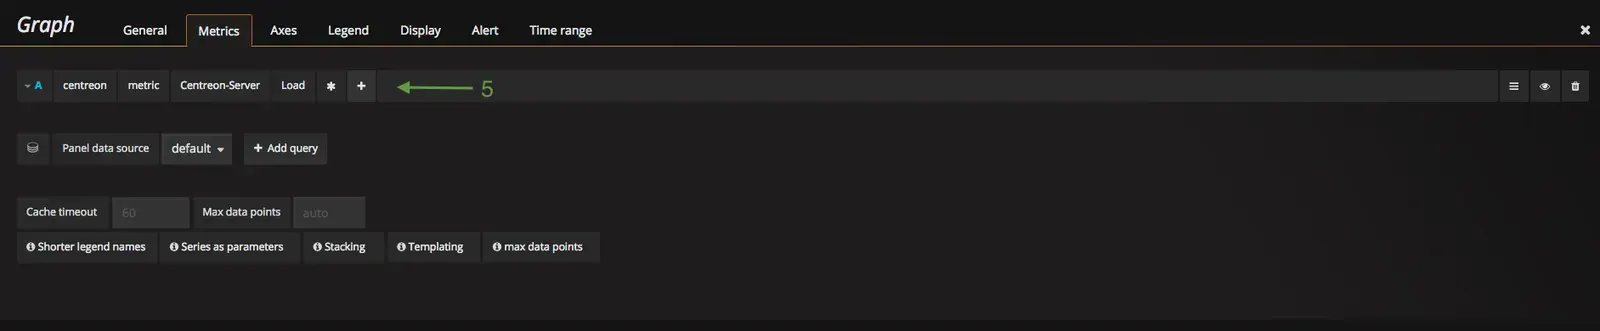
For a better display change “null value” to “connected”.

Now you can see your chart:

Add a square to represent the status of load1.
Then, install “Status panel” plugin of Grafana:
grafana-cli plugins install vonage-status-panel
systemctl restart grafana-server
Add on previous line the “Status panel” component.

Name this component as “Centreon-Server – Load” and set 2 for span.

Select load1 metric of Load service linked to Centreon-Server server.

And set same thresholds than from Centreon.
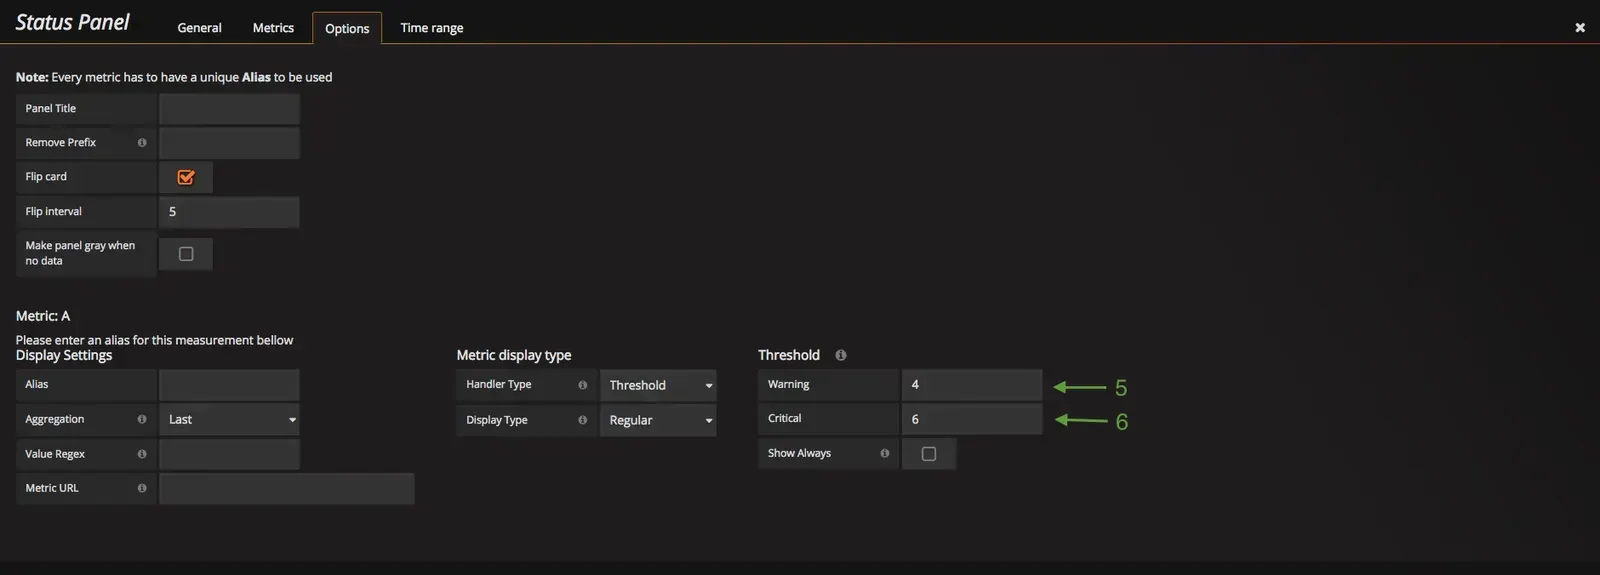
You have now the chart and the associated status:

Now, let’s talk your imagination to create your custom dashboards.
Looking for more tutorials?
- Create your own custom view with Centreon
- How to translate Centreon
- How to automate your Centreon monitoring with Salt
- Centreon MAP 4.2: create object and view templates