

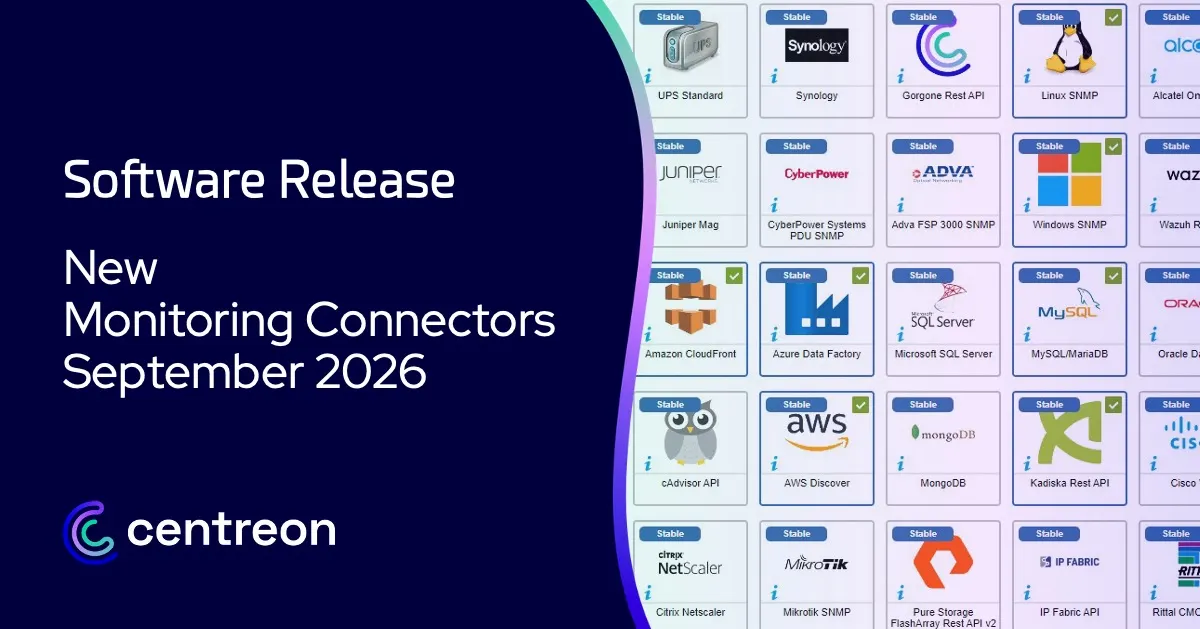
This month, XCP-ng and Xen Orchestra join the catalog with four Vates connectors developed in partnership with the vendor. Kubernetes gains CPU and memory usage monitoring per pod, and the Rust-based SNMP collection beta officially starts with three connectors.
You may also read the related documentation, contact our sales team, or post a message on The Watch to learn more.
Monitoring connector updates by the Numbers
- 7 new connectors added to the catalog
- 6 enhancements to existing connectors
- 5 fixes to existing connectors
New Monitoring Connector Highlights
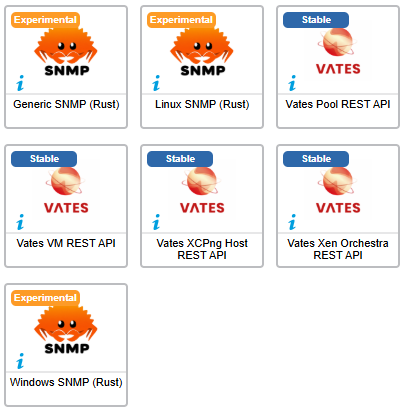
[New connectors] Vates XCP-ng & Xen Orchestra REST API
Why it matters
XCP-ng is an open source virtualization platform based on the Xen hypervisor. It is typically managed through Xen Orchestra, the web management interface published by Vates. Until now, no Centreon connector covered this environment. The need had been raised on The Watch.
We are releasing four connectors, developed in direct partnership with the Vates teams. They all query the Xen Orchestra REST API, and each one covers a level of the infrastructure. You can monitor your environment from the broadest view down to the finest detail, and quickly pinpoint where a problem comes from.
- Xen Orchestra, for the overview.
- Pool, for the health of the cluster.
- XCP-ng Host, for each hypervisor.
- VM, for each virtual machine.
Typical use case
You run one or more XCP-ng pools managed by Xen Orchestra. You want to be alerted if a VM stops unexpectedly, a host is disabled, the pool master is no longer running or a storage repository is filling up. Just declare the Xen Orchestra host in Centreon: host discovery rules then let you automatically create the pools, hypervisors and VMs to monitor.
Monitored modes
- Xen Orchestra: status, vm-status, storage-repository
- Pool: status, cpu-overcommit
- XCP-ng Host: status, cpu, memory
- VM: status, cpu, memory
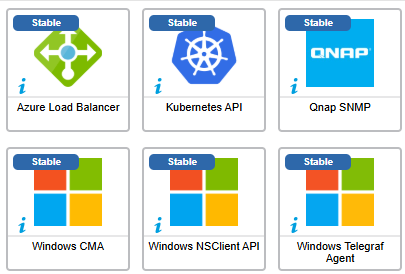
[Enhancement] Kubernetes API: CPU and memory usage per pod
Why it matters
The Kubernetes API connector already tracked the state of cluster objects, but not the actual resource usage of each pod. The new pod-usage mode retrieves the CPU (in millicores) and memory (in bytes) usage of each pod through the metrics.k8s.io API. It also expresses it as a percentage of the declared resource requests. This lets you spot a pod exceeding what was reserved for it, before it reaches its limit. A service discovery rule automatically creates one service per pod.
Typical use case
You host applications on a Kubernetes cluster and want to track the resource usage of specific pods in Centreon, filtered by namespace, pod name or container. Prerequisite: metrics-server must be installed and reachable in the cluster.
Monitored modes
- pod-usage
Rust-based SNMP collection: the beta is open
Announced this summer, SNMP collection based on a plugin written in Rust is now available in beta through three connectors:
- Generic SNMP (Rust)
- Linux SNMP (Rust)
- Windows SNMP (Rust)
The plugin does not hard-code its indicators. It relies on collections described in JSON. Their format is now documented by a published schema, in English and French, in the GitHub repository. This schema enables completion and validation directly in editors such as VS Code or PyCharm. Note that the current collection format (version 0) is the beta format and may still change until the first stable version. A changelog section in The Watch beta group will let you follow these changes throughout the beta.
We look forward to your feedback on this project. Feel free to join the beta group on The Watch!
Important information: empty outputs, OK → UNKNOWN
Until now, a check could in some cases return an OK status with an empty output. This happened, for instance, with an overly restrictive filter, which left monitoring silent without raising any alert. In these situations, an UNKNOWN status should now be correctly reported.
Monitoring Connector Update Summary
New Monitoring Connectors
Enhancements
Bug fixes
For more details, check out the full release note.
Want to help or suggest improvements?
- You can submit an idea on The Watch.
- Or contribute on GitHub.
See you next month for more new monitoring connectors!