


Yes and yes. IT infrastructure monitoring (some call it network monitoring) has evolved over the years to incorporate a focus on business performance, tracking the essential workflows that support the ability of a business to, say, sell burgers. But some things never change. The core aspect of IT monitoring is still to promptly spot, acknowledge and fix issues. Mean Time to Repair or MTTR still counts and will remain a fixture of SLA agreements for a long time to come. This blog post describes its value as a KPI and lists a few of the modern IT monitoring must-haves that can help you improve your MTTR. You’ll see that some of the 20.04 software update serve exactly this purpose.
What is MTTR?
If you are wondering what is MTTR, the expression Mean Time to Resolution (or Repair) refers to the time elapsed from the start of an incident up to the moment the IT asset returns to production. Here’s the typical sequence of events that are calculated to define MTTR:
 |
✅ Notify technician ✅ Acknowledge the issue ✅ Diagnose the issue ✅ Fix the issue ✅ Reset, test, and return the asset to production |
“Optimized event management, root cause analysis and MTTR are important, and even more so in the context of architecture distributed between on-premise and cloud environments, where lack of holistic visibility can be costly. They are the fundamentals of maintaining the health and performance of the IT system.”
How to optimize your MTTR in the 2020s
 |
Ability to respond and acknowledge alerts
Murphy’s law requires that most alerts happen at night or at any other inconvenient time, when your IT monitoring console is not within immediate reach. The sooner you can check on an alert, the better your MTTR. |
 |
Root cause analysis ergonomics
If you’ve heard of carpal tunnel syndrome, you know ergonomics is no luxury. Avoiding repetitive movements increases comfort, enhancing productivity. Reducing the number of clicks needed to drill down to the root cause also saves precious time. |
 |
Monitoring from cloud to edge
Swivel chair syndrome is yet another time waster. It’s what happens when you need to log into various tools to get to the root cause of a problem. A single line of sight across all cloud assets and on-premise architectures simplifies root cause analysis and increases collaboration across teams and locations. |
 |
Constantly current perimeter
IT systems being highly dynamic, manually updating the perimeter no longer makes sense. But an inaccurate perimeter will contribute to an expanding MTTR. Automation and integration capabilities will expedite both the deployment and maintenance phases. |
 |
Visibility and control over remote sites
Distance is a problem when trying to manage geographically distributed operations optimally. Accurate visibility and control over remote sites can significantly accelerate root cause analysis, even in the absence of local support staff. |
“We constantly work with our user community to enhance the ergonomics of our platform. The new Centreon event management user interface, for example, is the result of design workshops we held with users.”
4 ways Centreon 20.04 helps with event management, root cause analysis, and faster MTTR
Updating to the latest Centreon 20.04 version will not only help you optimize event management and MTTR, it will improve your experience and output.
1- New mobile app
-
- Get to alerts and manage them promptly, regardless of where you are or the time of day.
- Works with all Centreon editions updated to 20.04, on iphone or android devices.
- See hosts & services current status (list/filter)
- Take action: acknowledge or set a planned downtime
- Review detailed information and generate graphs
→ Android: Google Store or from mobile.centreon.com “Add to home screen”
→ iOS: from mobile.centreon.com “Add to home screen”
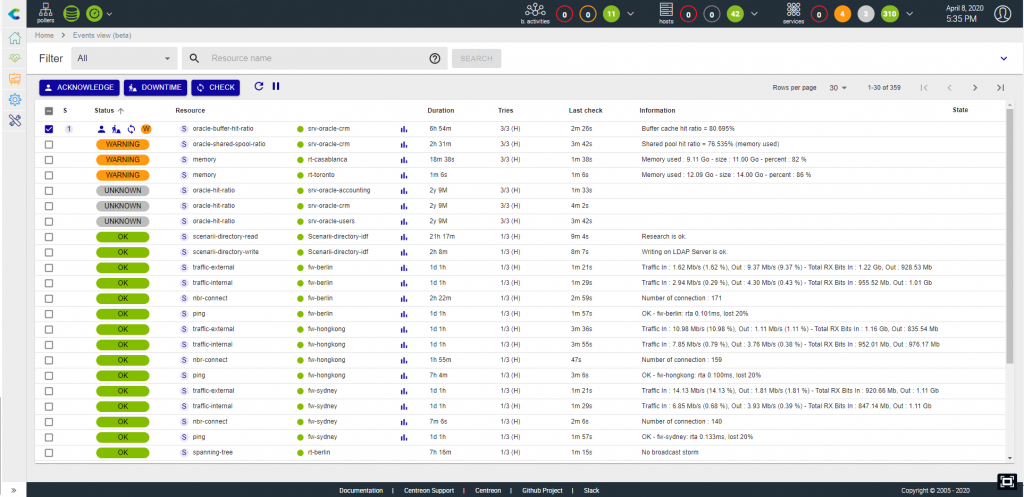
2- New event management view to get to issues faster.
- Cocreated with users to optimize experience and comfort.
- Improved navigation through all levels of detail.
- Saves time and clicks to accelerate root cause analysis.
- Makes it easier to navigate through all relevant information, performing root cause analysis
- Save and reuse filters (coming soon)
- Sort and reorganize columns at will (coming soon)
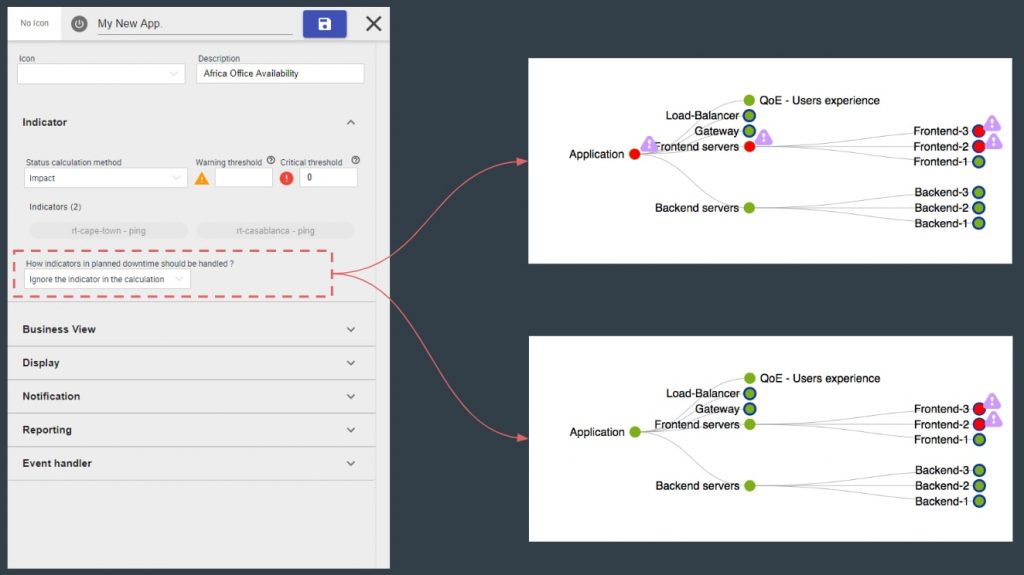
3- More service mapping options
- Service mapping can now be applied to remote sites (retail stores, warehouse, etc.). You save time modelling what’s required at the edge for a remote site to be IT operational.
- Using Centreon APIs, ITOps teams can automatically generate real-time graphical views of each and every remote site to determine if everything is up and running, without having to rely on local support.
- Status of each remote site is visible on a geographical view (Centreon Geoviews) that drill-down directly to a given remote sites’ details. Knowing what’s going on at the edge of the network ensures the right support decision is taken – local support is not always a necessary expense when you have that kind of detailed visibility.
- The new options save time when mapping typical application architectures or handling planned downtime inheritance.
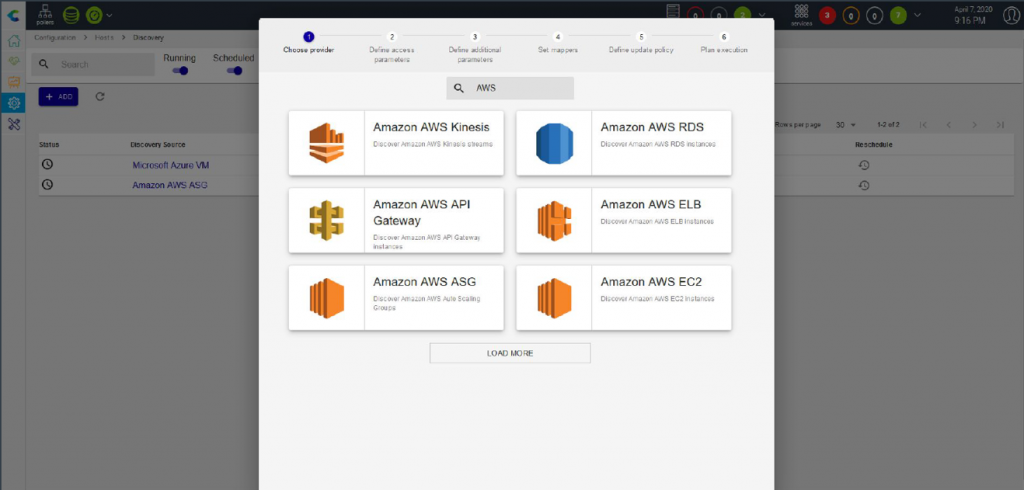
4- Additional auto discovery capabilities
- Keep track of vast and dynamic infrastructure, for always current, holistic monitoring, from cloud to edge.
- Associate discovered value to configuration value
- Add an additional template based on discovery value
- Select the poller which will monitor the resource
Login to your Centreon platform and update to the latest Centreon version today.
Not yet a Centreon user? Monitor up to 100 devices for free with Centreon IT Edition. No limit in time! Try it for free.
Share


