


Centreon is an ultraconnected monitoring solution and our teams regularly develop new features to help you gain even more interoperability within your environment.
Our teams have now enhanced the website monitoring base to introduce the use of Curl and thus benefit from more possibilities to meet the needs of URL monitoring from the simplest to the most demanding.
This article describes the new feature which will soon be available to help you understand exactly how to analyze the response time details of your favorite applications and websites.
What is Curl and should you be using it?
Curl is a set of open-source libraries and command lines developed since 1998 by Daniel Stenberg and a community of contributors. Curl supports a large number of protocols for data transfer and is often defined as a Swiss Army knife. Whether you work in IT or not, you use Curl every day, without being necessarily aware of it (using printers, TVs or connected vehicles, etc.).
System and network administrators regularly use this command line to test application, website or simply Internet connectivity.
URL connection steps that can be monitored with Centreon
When you connect to a URL, multiple steps are required to display the content associated with it. Through the Curl f HTTP protocol library features, each step can be accurately measured.
The steps that can be monitored with Centreon are the following:
- The name resolution (lookup) which is in fact the interrogation of a DNS server to obtain the IP address, The connection (connect), which corresponds to the time necessary to reach the target (or the proxy) via the address obtained in the previous step.
- The security (tls), representing the time needed to establish the secure communication and the associated encryption steps. This step is only measured when using HTTPS.
- The processing phase (processing) represents the time to process the request and the associated code execution at the backend level. This measurement can be considered as the closest to the time elapsed until the first byte received, generally known as TTFB (Time To First Byte).
- The transfer phase (transfert), which corresponds to the time elapsed between sending the display request to the server (GET) and receiving the information on the client side.
These steps provide some indication to uncover and understand duration information, and thus identify potential areas for optimization or bottleneck risk.
Monitor your URL with Centreon Plugin Packs
To monitor your website URL, make sure that the Plugin Pack “HTTP Server” is installed on your Central server. Go to the “Configuration > Plugin Packs > Manager” menu and search for HTTP Server. When the pack is installed, it displays as follows:
You also need the monitoring plugin installed on the Central server and on each of the Pollers if you have any. This can be done with the following command:
yum install centreon-plugin-Applications-Protocol-Http
Once these prerequisites are validated, you can create your Host in Centreon. To do this, go to the menu “Configuration > Hosts” and click on “Add” to configure your monitoring:
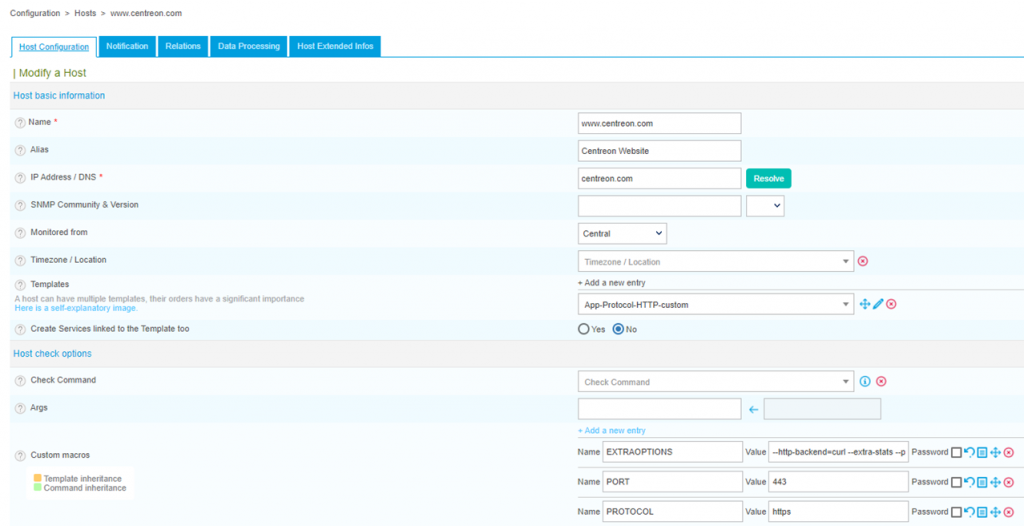
The mandatory elements of the form are as follows:
- Application of the appropriate Host Model:

- Fill in the parameterization macros :

These macros are central because they describe the parameters you want to use to run the control. Here is the meaning of the above configuration:
- PORT: The port on which the site listens for requests. For centreon.com it is 443.
- PROTOCOL: The protocol accepted by the server. For centreon.com it will be https.
- EXTRAOPTIONS: The additional options of the plugin, to have access to the statistics. We specify the use of curl and the activation of detailed information. Respectively:
--http-backend=curl

--extra-stats
Warning!
If you use a proxy, add the following option to the EXTRAOPTIONS macro of your Host:
--proxy-url='protocol://your.proxy.domain:port'
Once this configuration is done, you can save the form and you will automatically get detailed Ping and HTTP response time checks.
Deploy your configuration and that’s it, your sites are monitored!
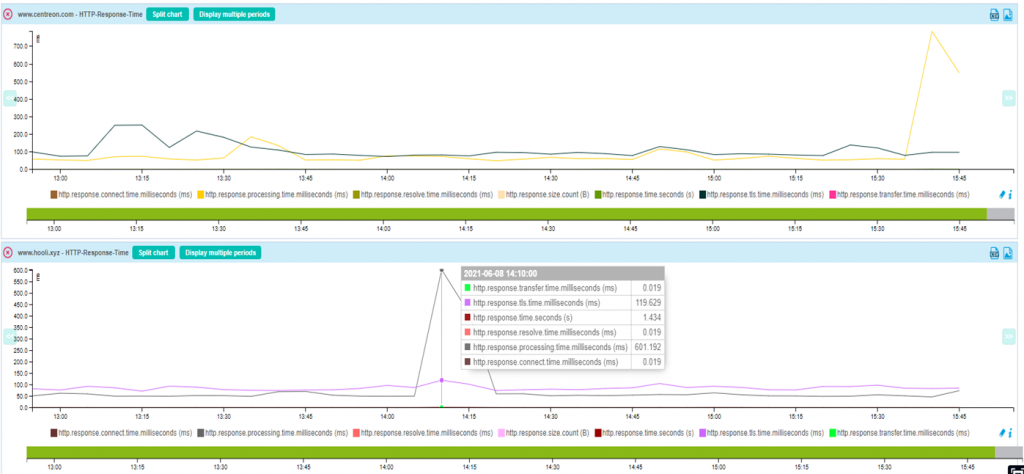
As you can see on the graph, we can easily detect which step took the longest and had the biggest impact on the overall response time. Here we can see that it is the processing phase that has slowed down with the peak (which is quite visible!).
Next steps
How about comparing your response time results from different locations around the globe?
By deploying this same configuration and running it on Pollers or servers in different locations around the globe, you can compare the graphs and see how each stage performs depending on the geographical area.
If you have any questions, ask them on the centreon-plugins channel of our Community Slack.
Share


